Trading. Research. Backtests.
One workstation.

The free basic edition is being prepared. Explore the actual interface and workflow first.

Screen markets. Test strategies. Connect execution and review.

For individuals and small or midsize teams. Bring market observation, quantitative research, backtesting, trading and review into one connected workflow. Keep markets, strategies and records in context.

Browse all capabilities

A real workspace. A connected view.

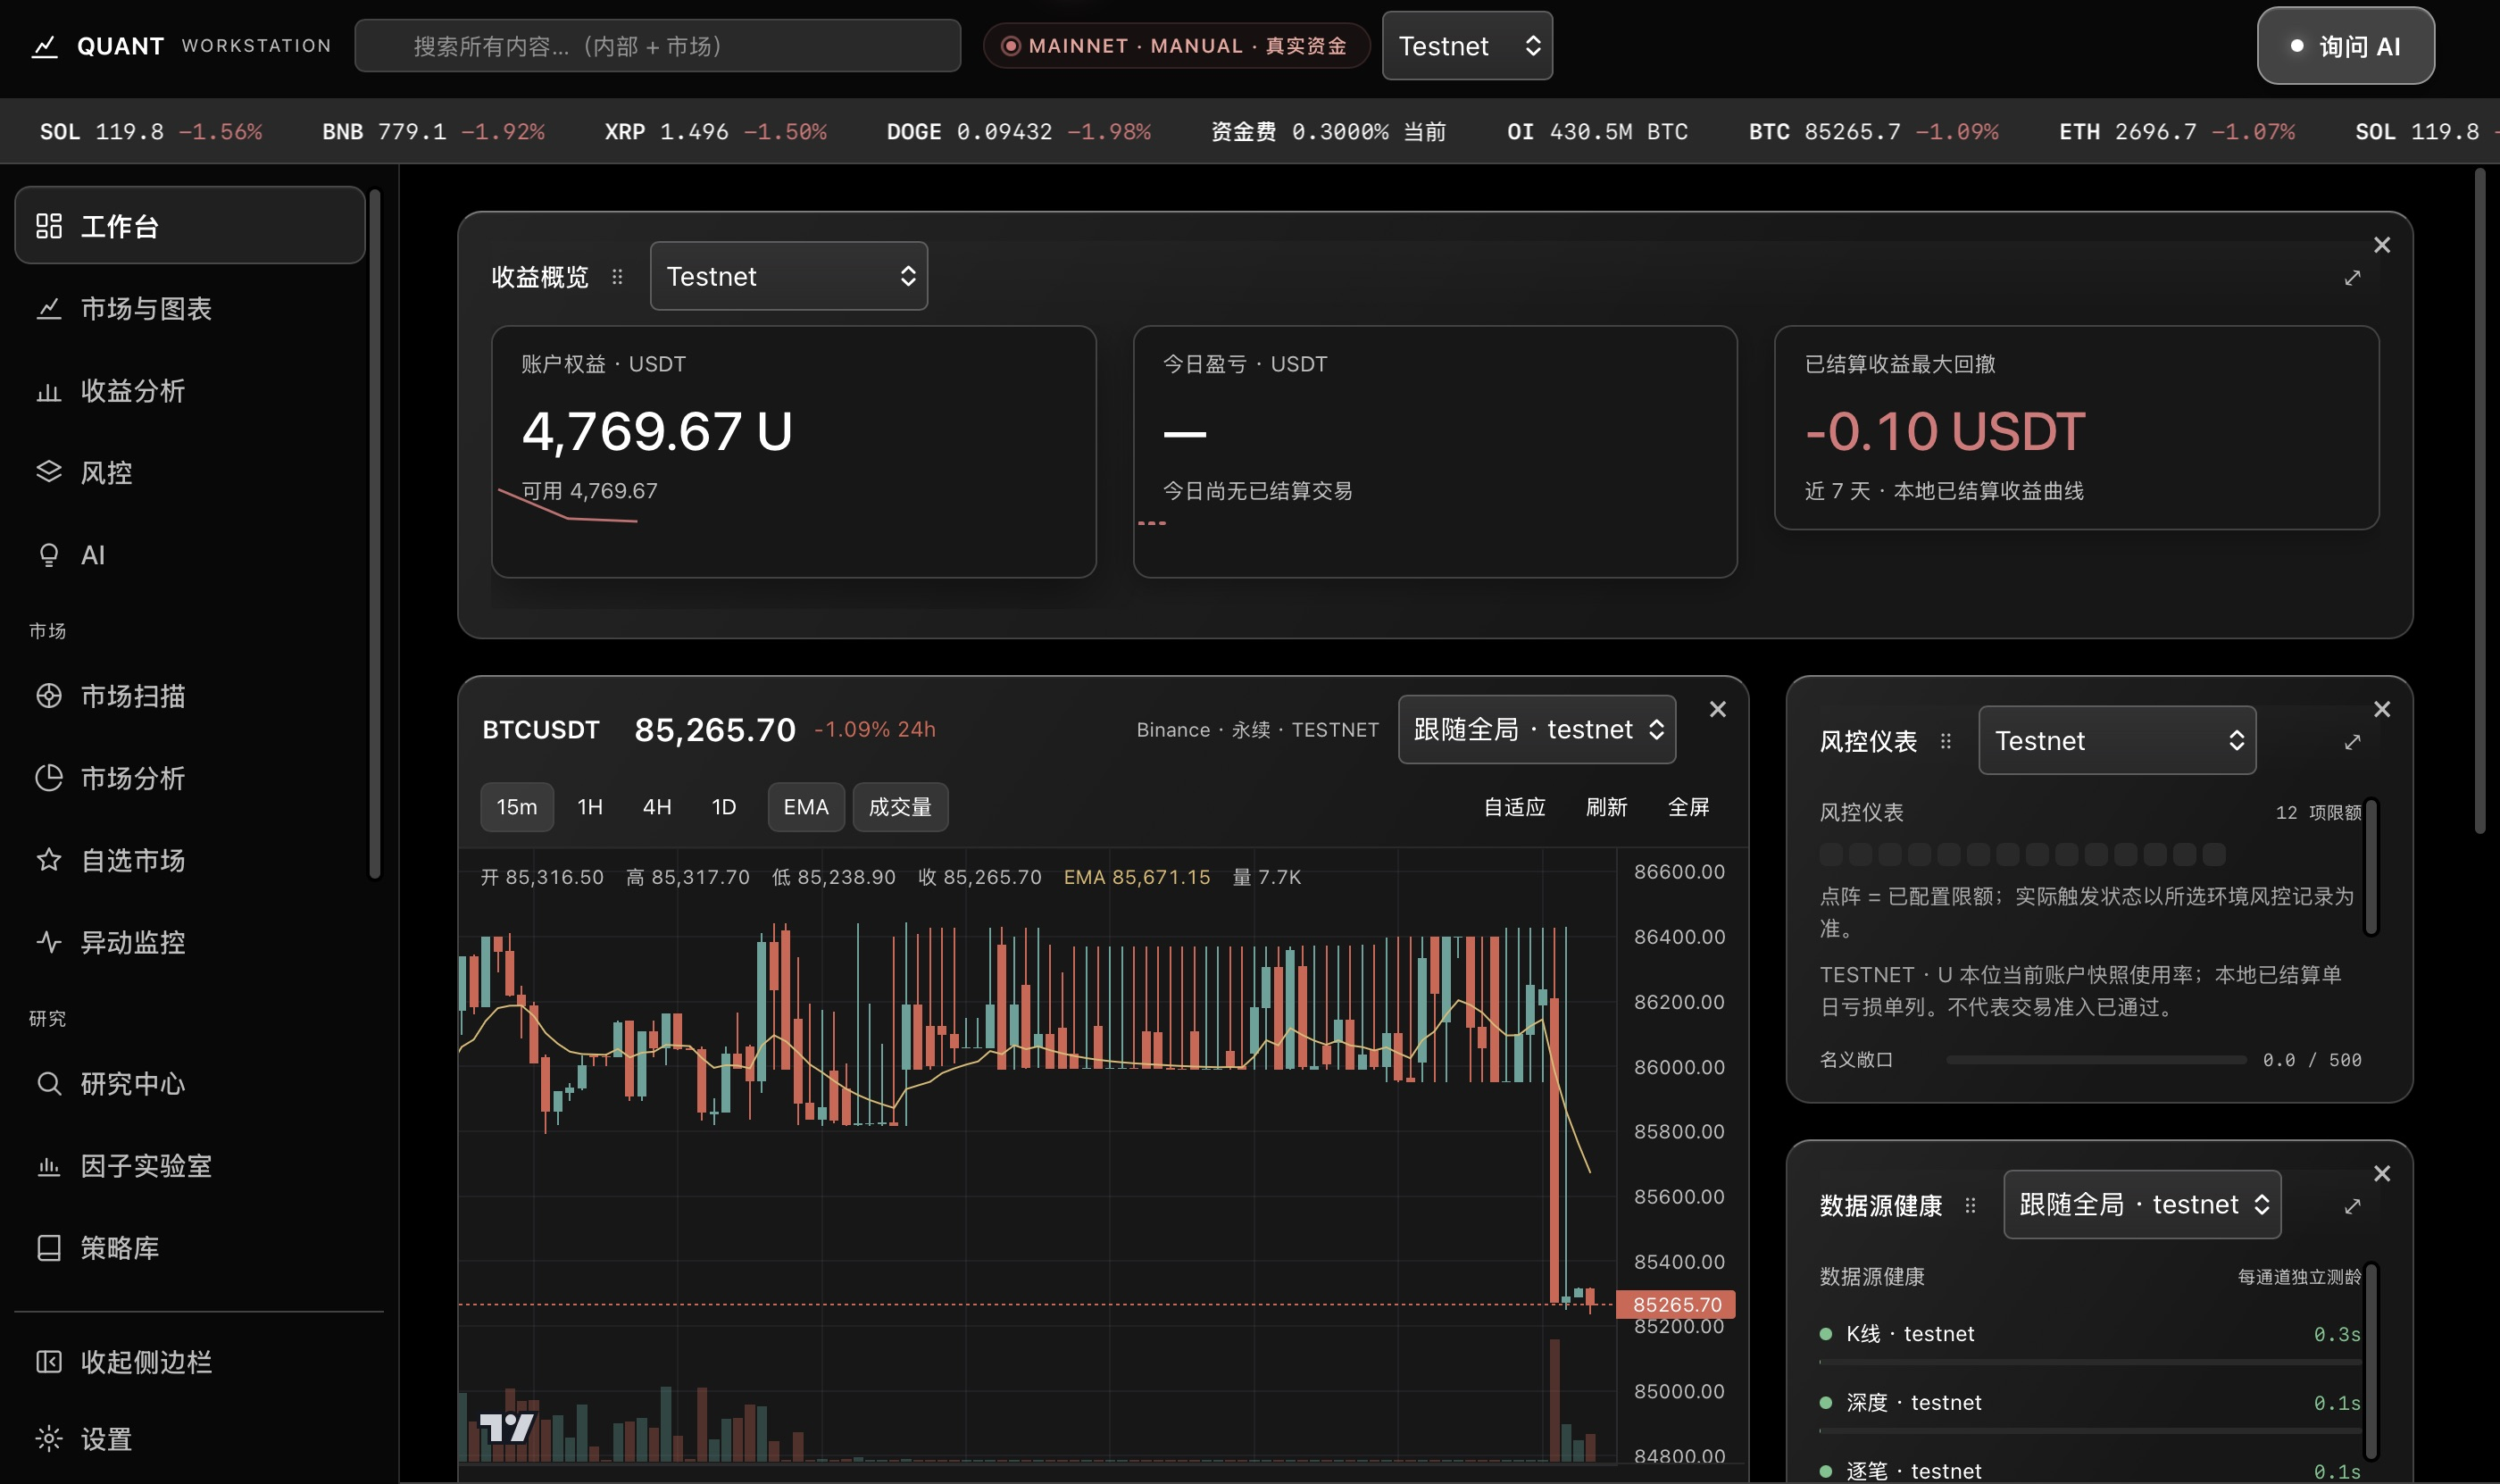
Upper workspace: returns, markets, risk and data health

Performance overview · Charts · Risk dashboard · Data health

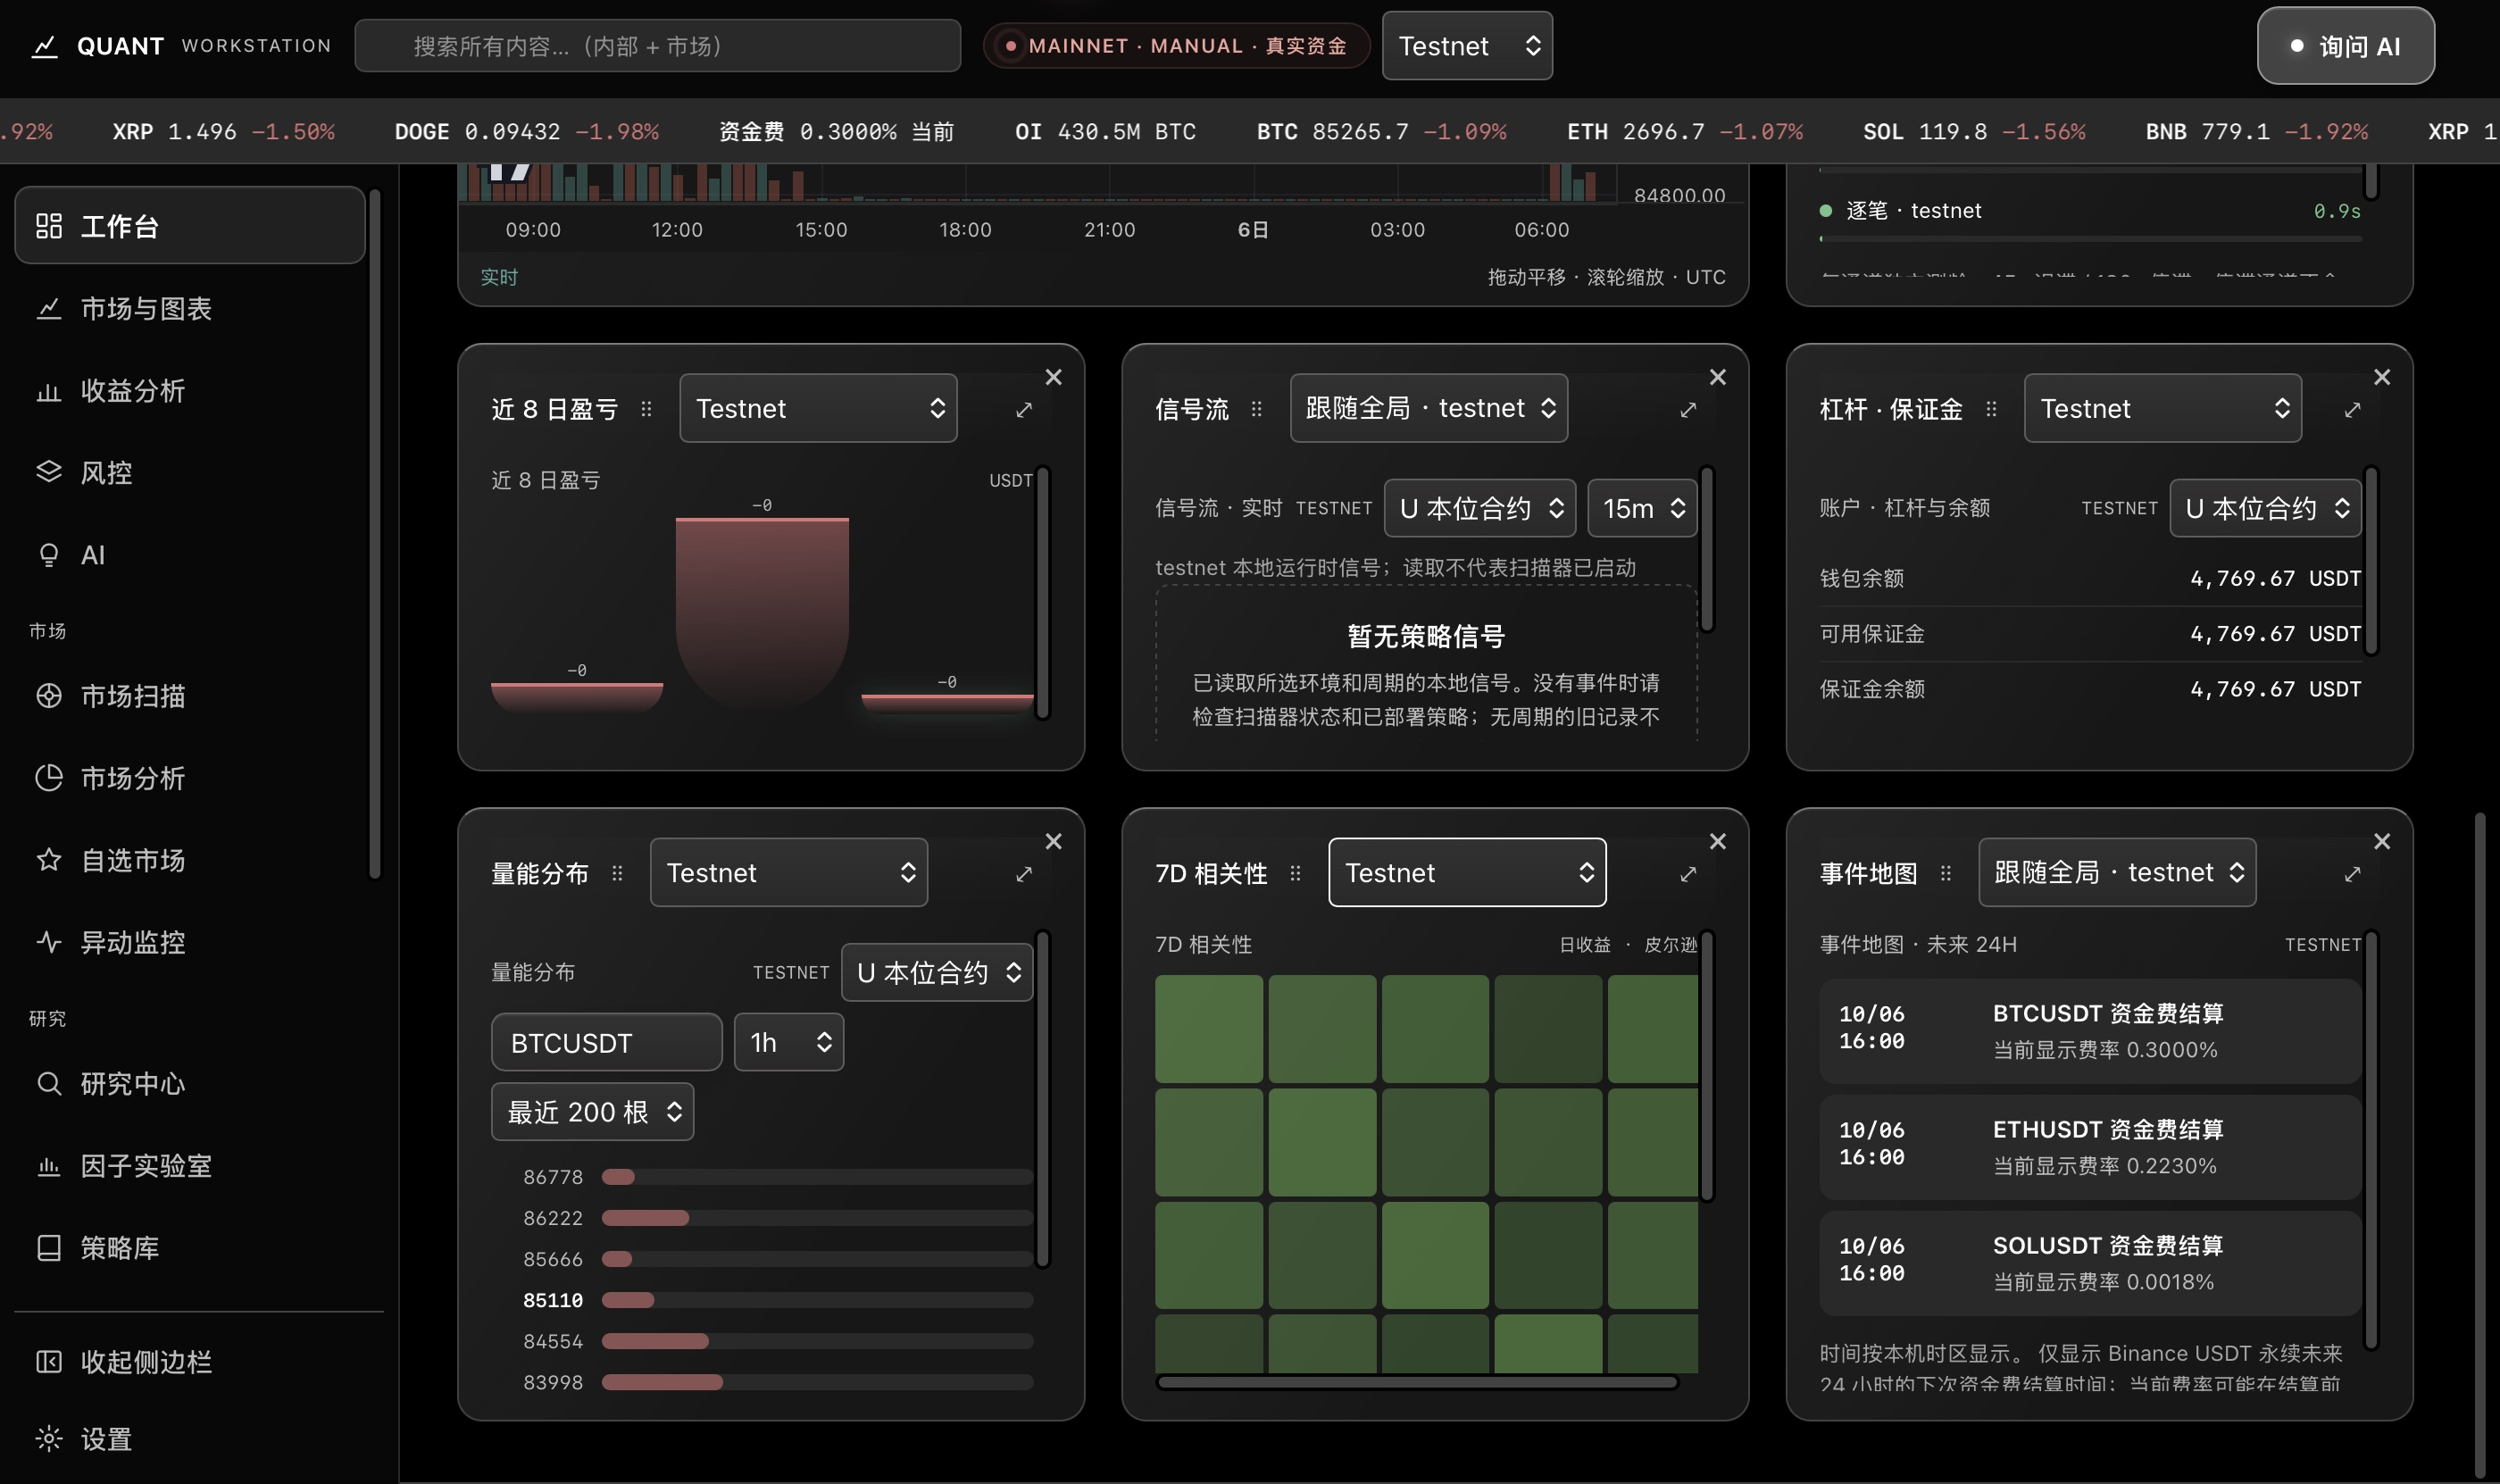
Lower workspace: performance, signals and operations

Recent P&L · Signals · Leverage & margin · Volume · Correlation · Events

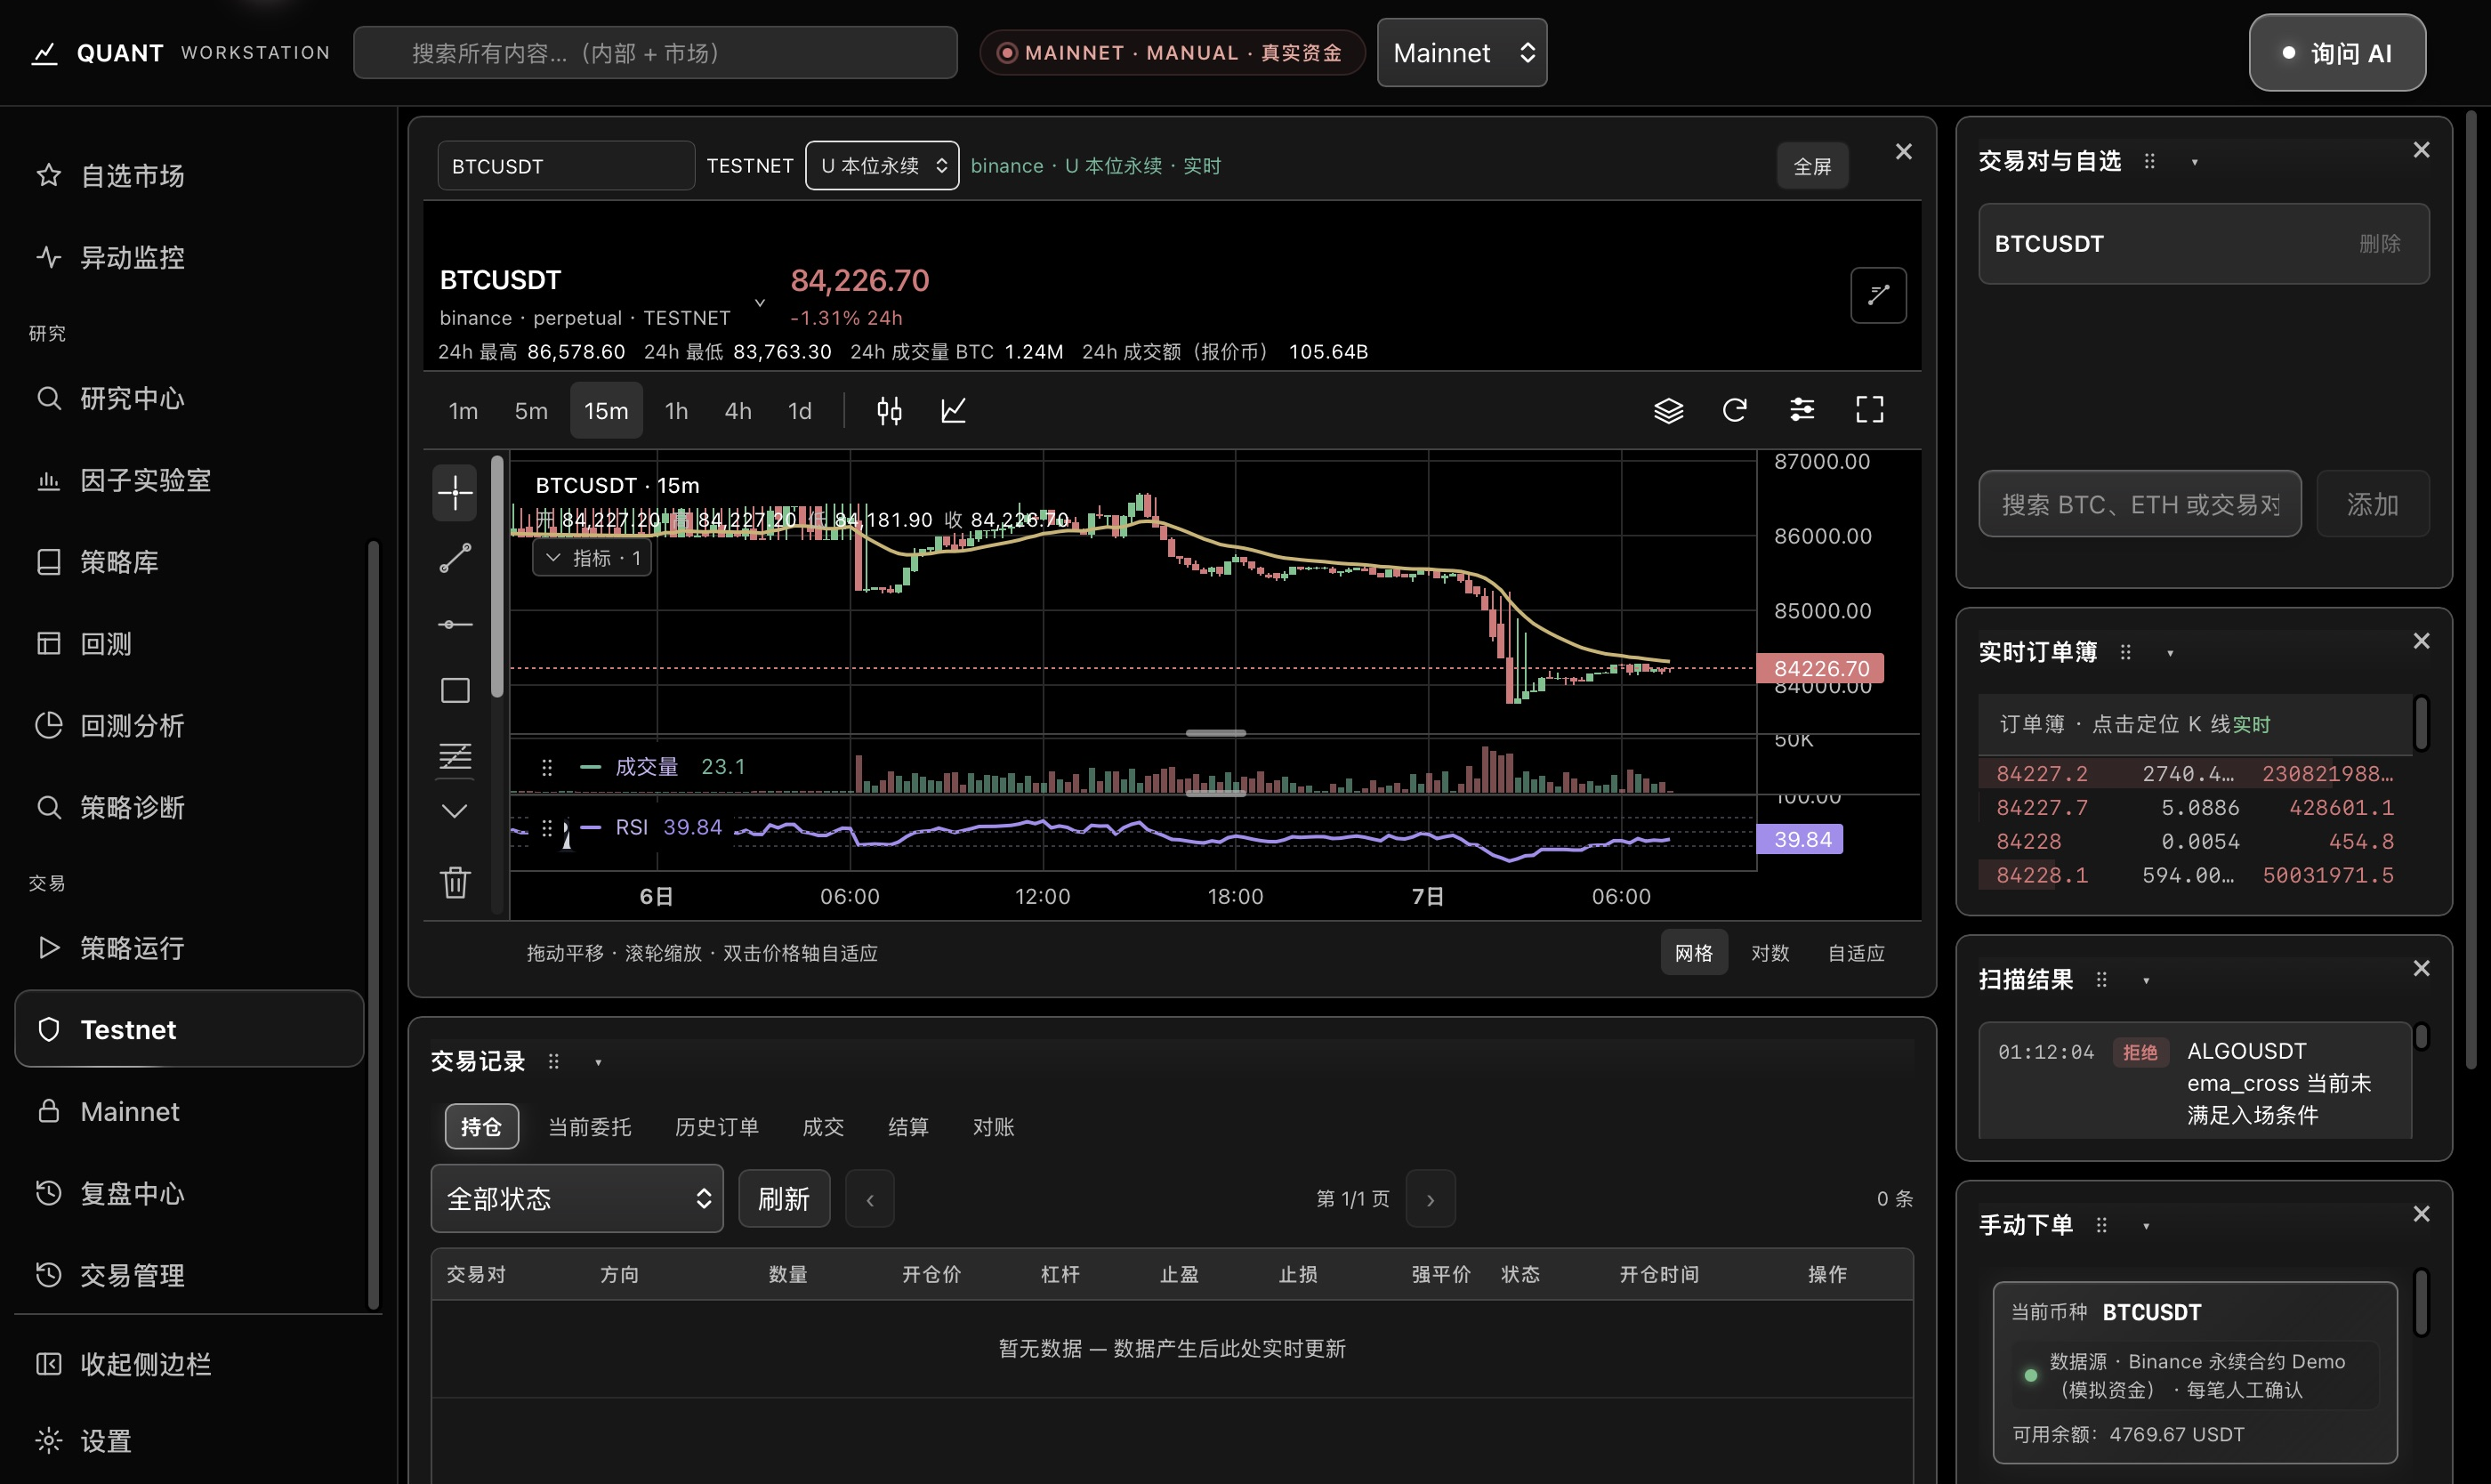
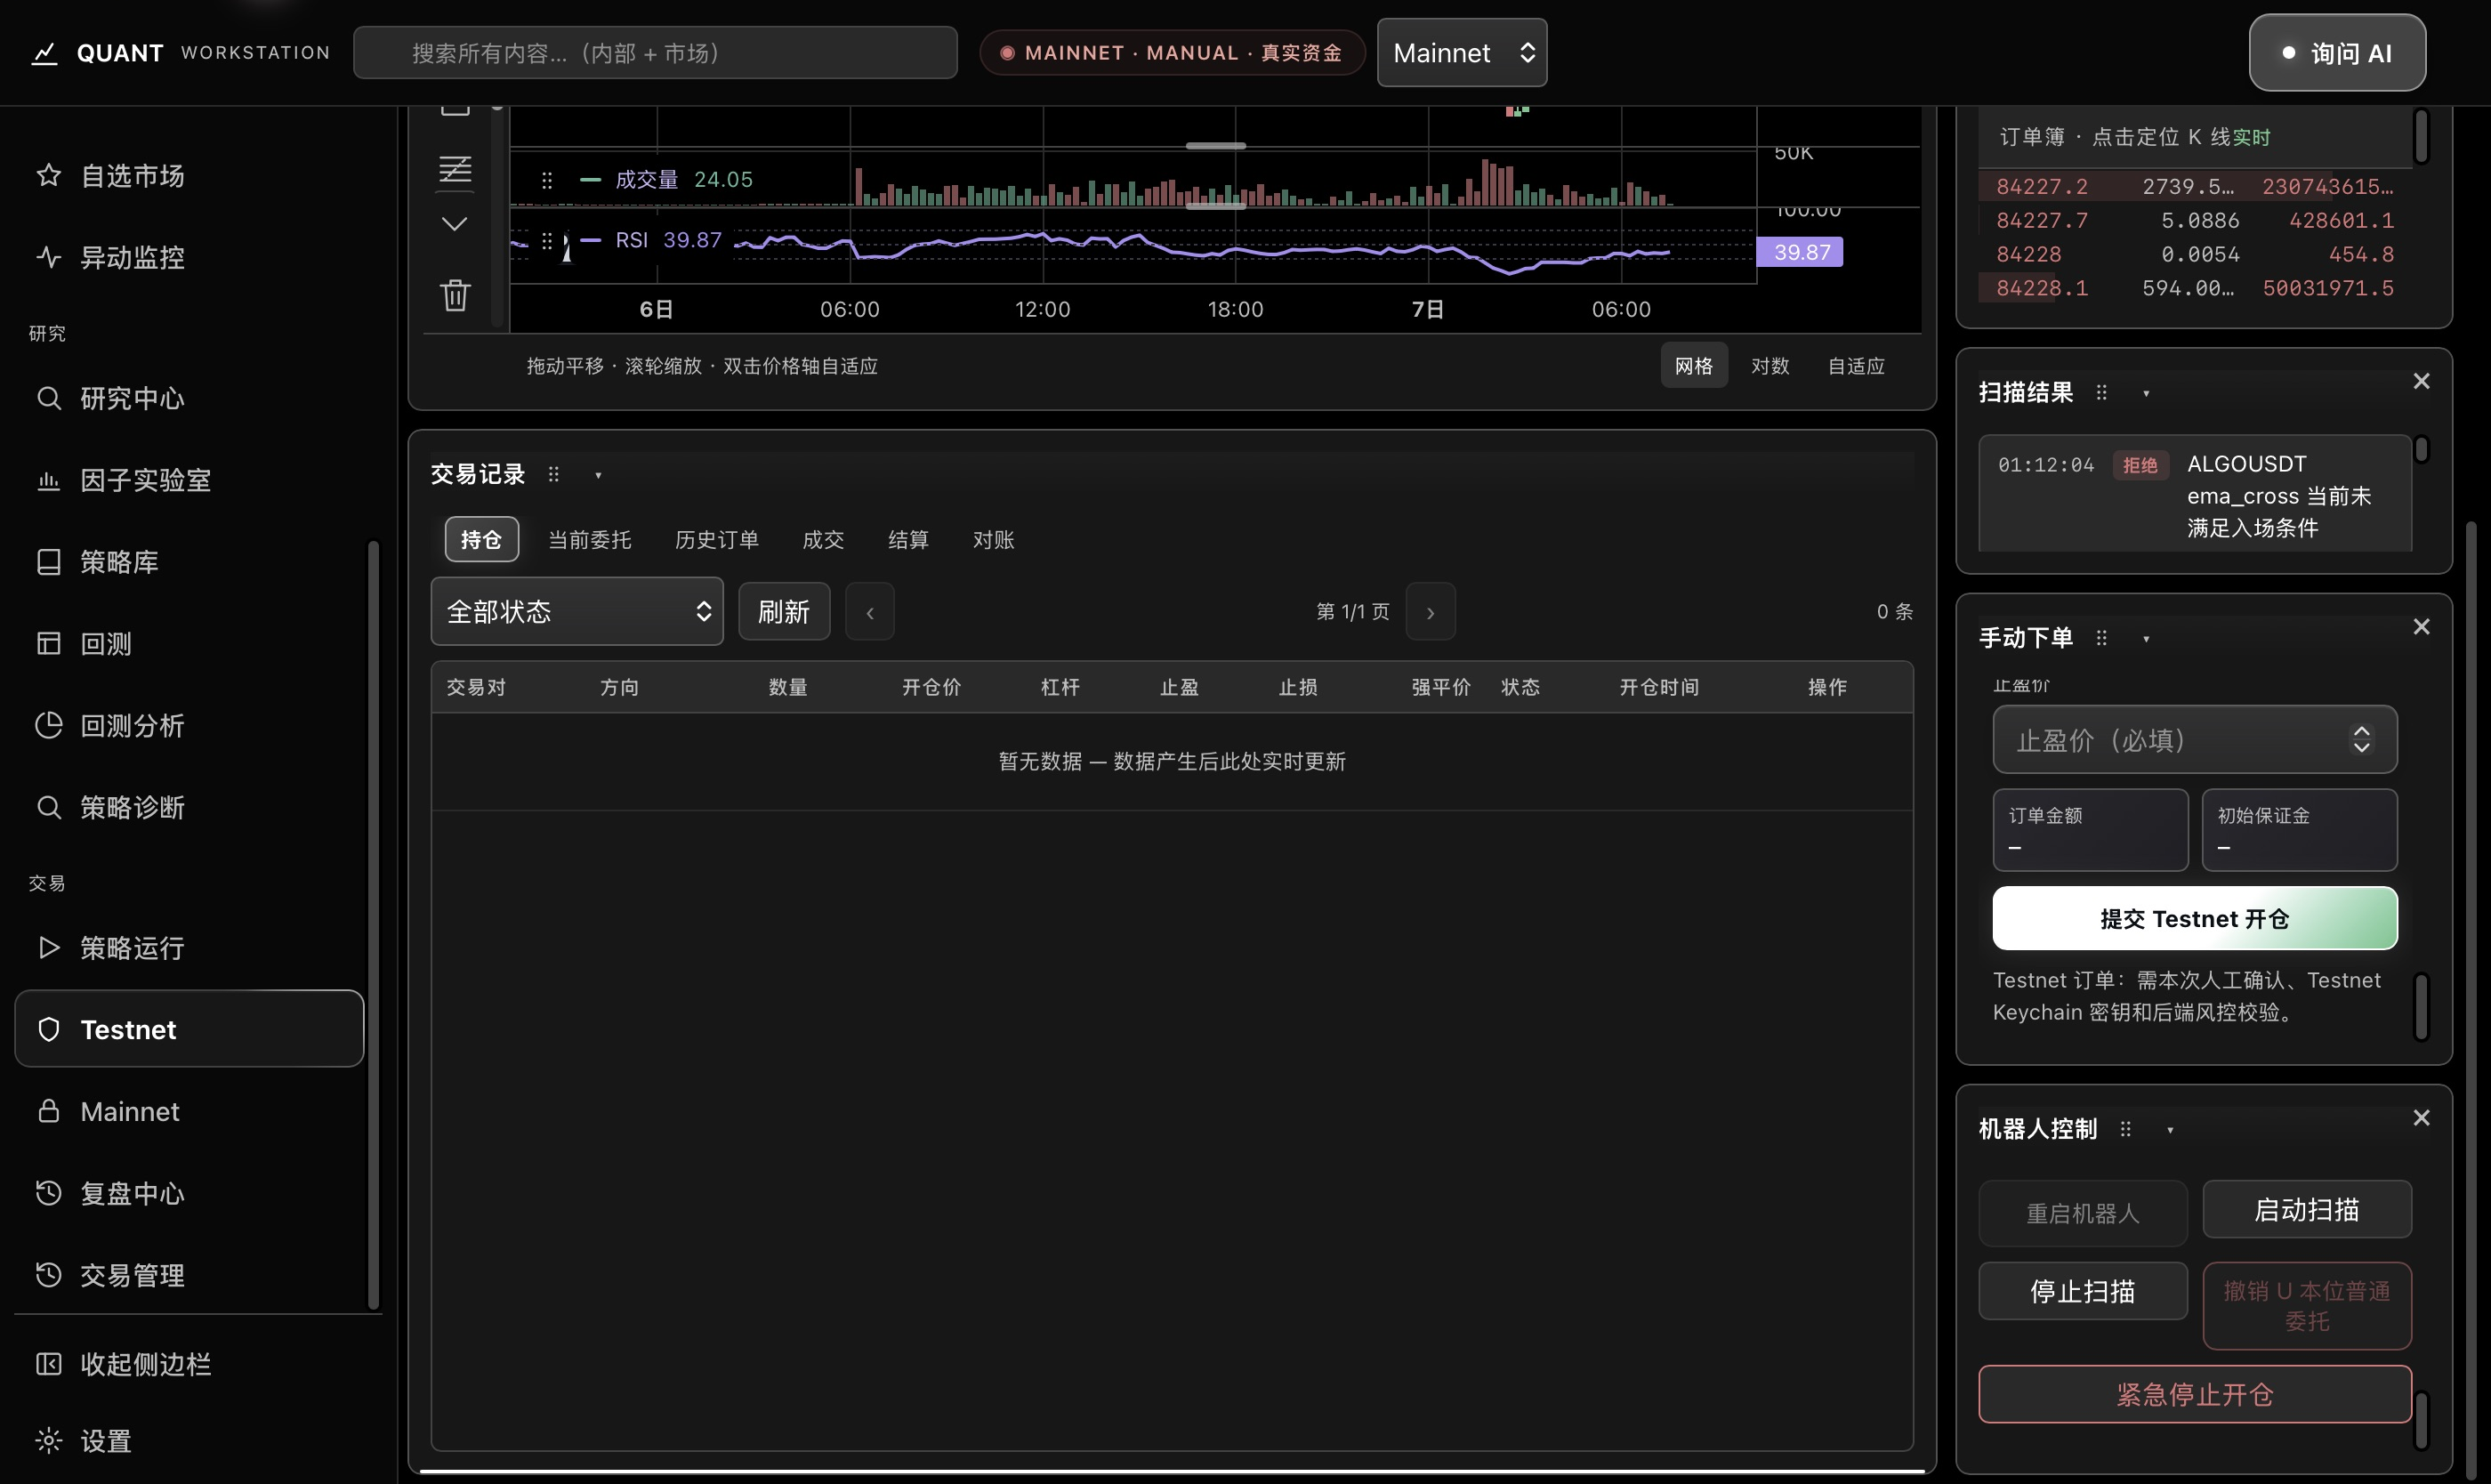
Actual macOS workbench. Modules show Testnet data; the original mode label is retained.

Continue to the product tour

From research to trading, keep the workflow connected.

  1. 1

    Market observation

    Find changes. Define your focus.

  2. 2

    Quant research

    Organize materials. Form an idea.

  3. 3

    Backtest validation

    Examine it against history.

  4. 4

    Trading execution

    Manage operations and status.

  5. 5

    Review & improve

    Revisit records. Refine the idea.

Return from review to research, with a record to guide each iteration.

Find markets worth a closer look.

Narrow your focus with filters, scan candidates through mini candlestick charts, then open a full chart for closer analysis. Keep your watchlist and AI direction research connected to the same market.

These screenshots show actual software windows. Long pages use separate views, each accompanied by its function and purpose.

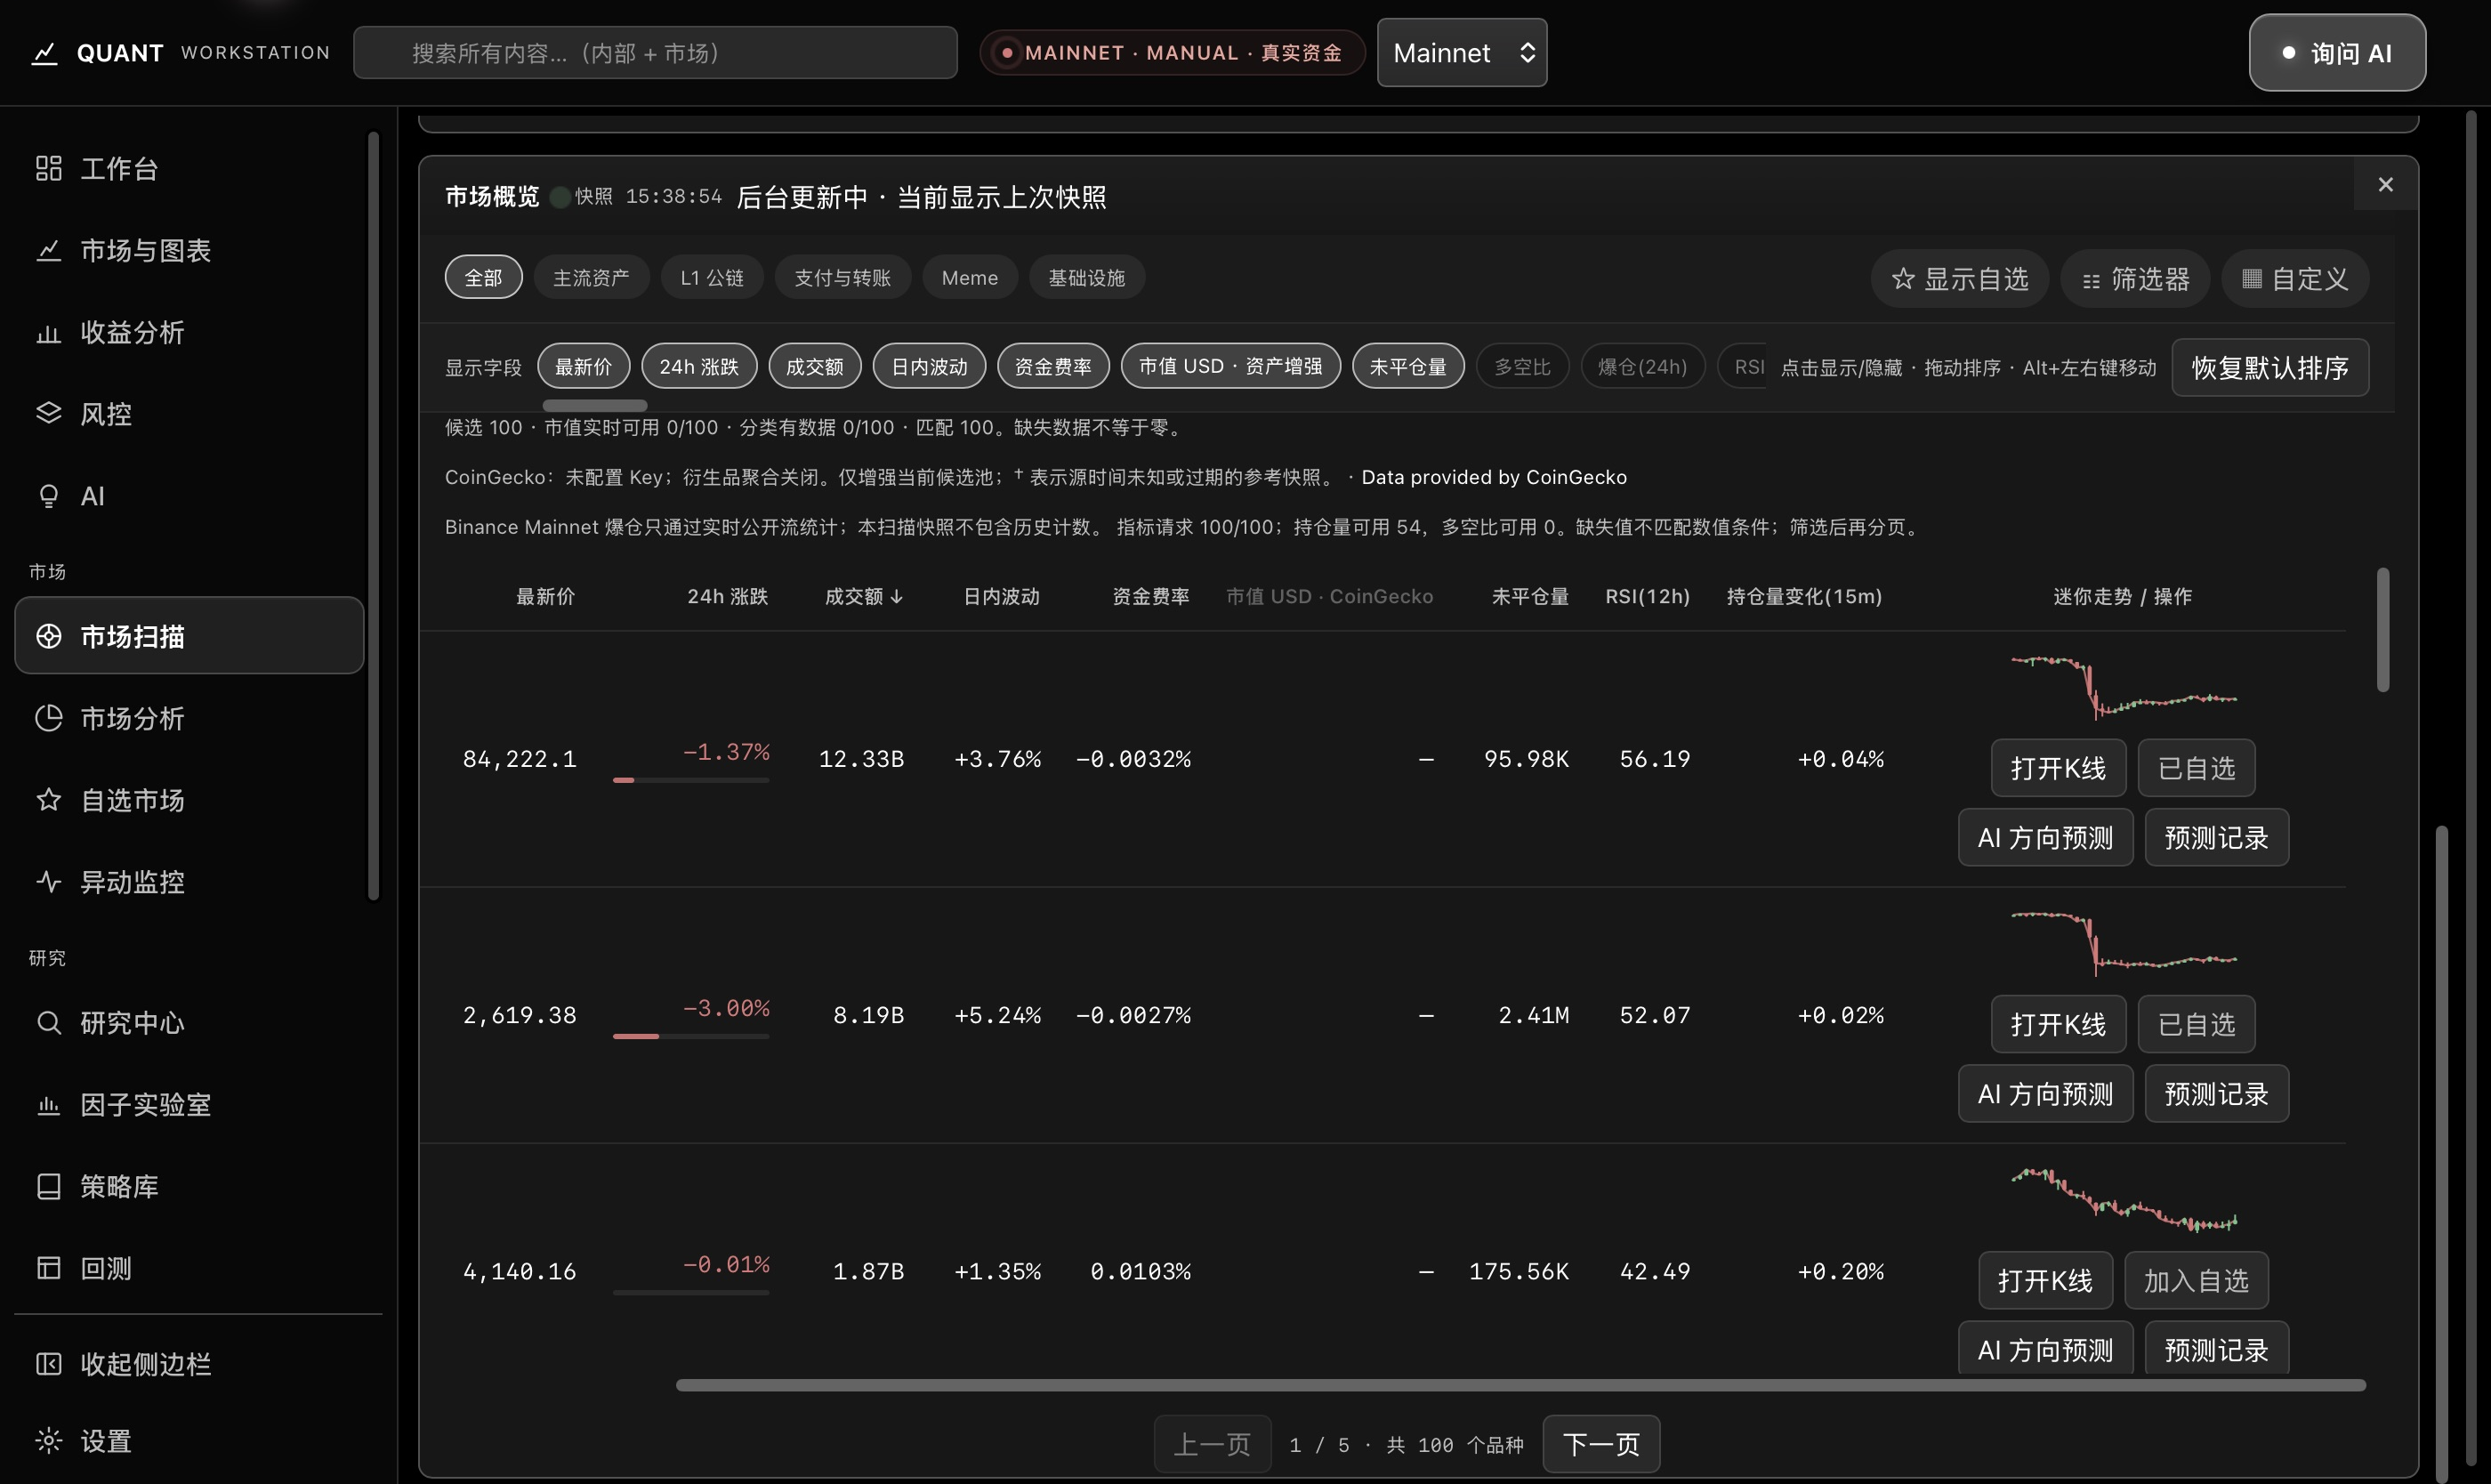
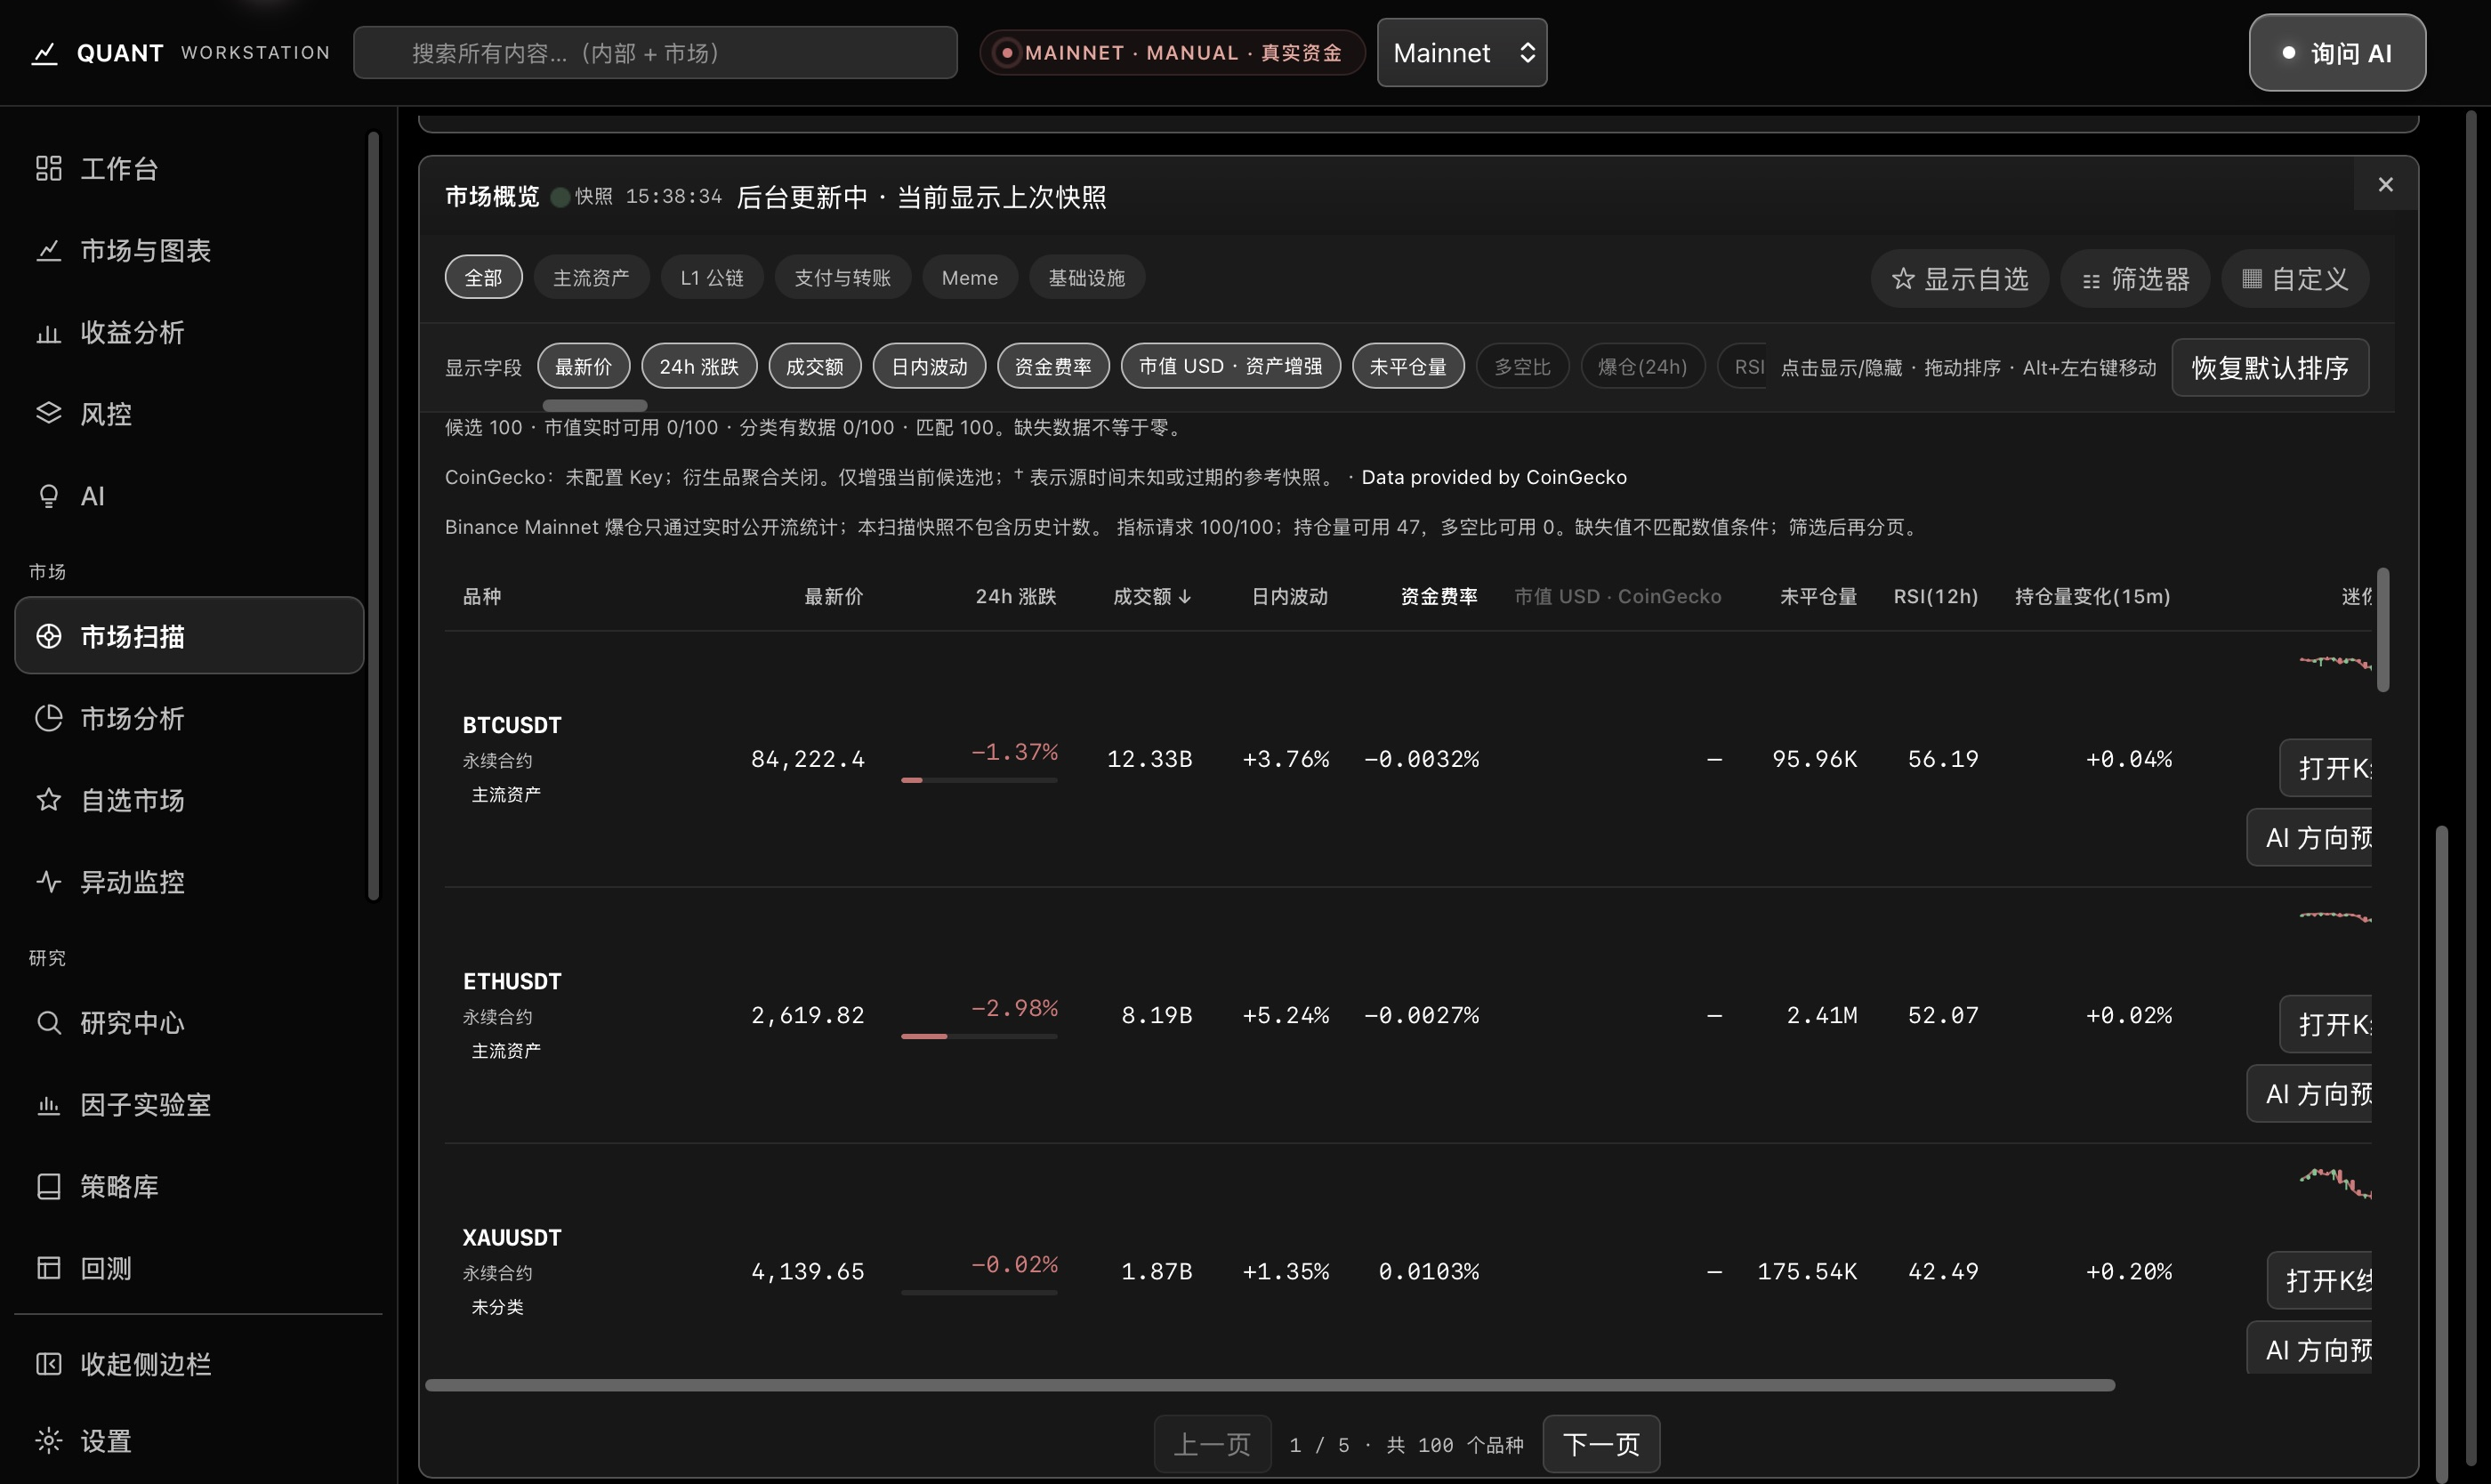
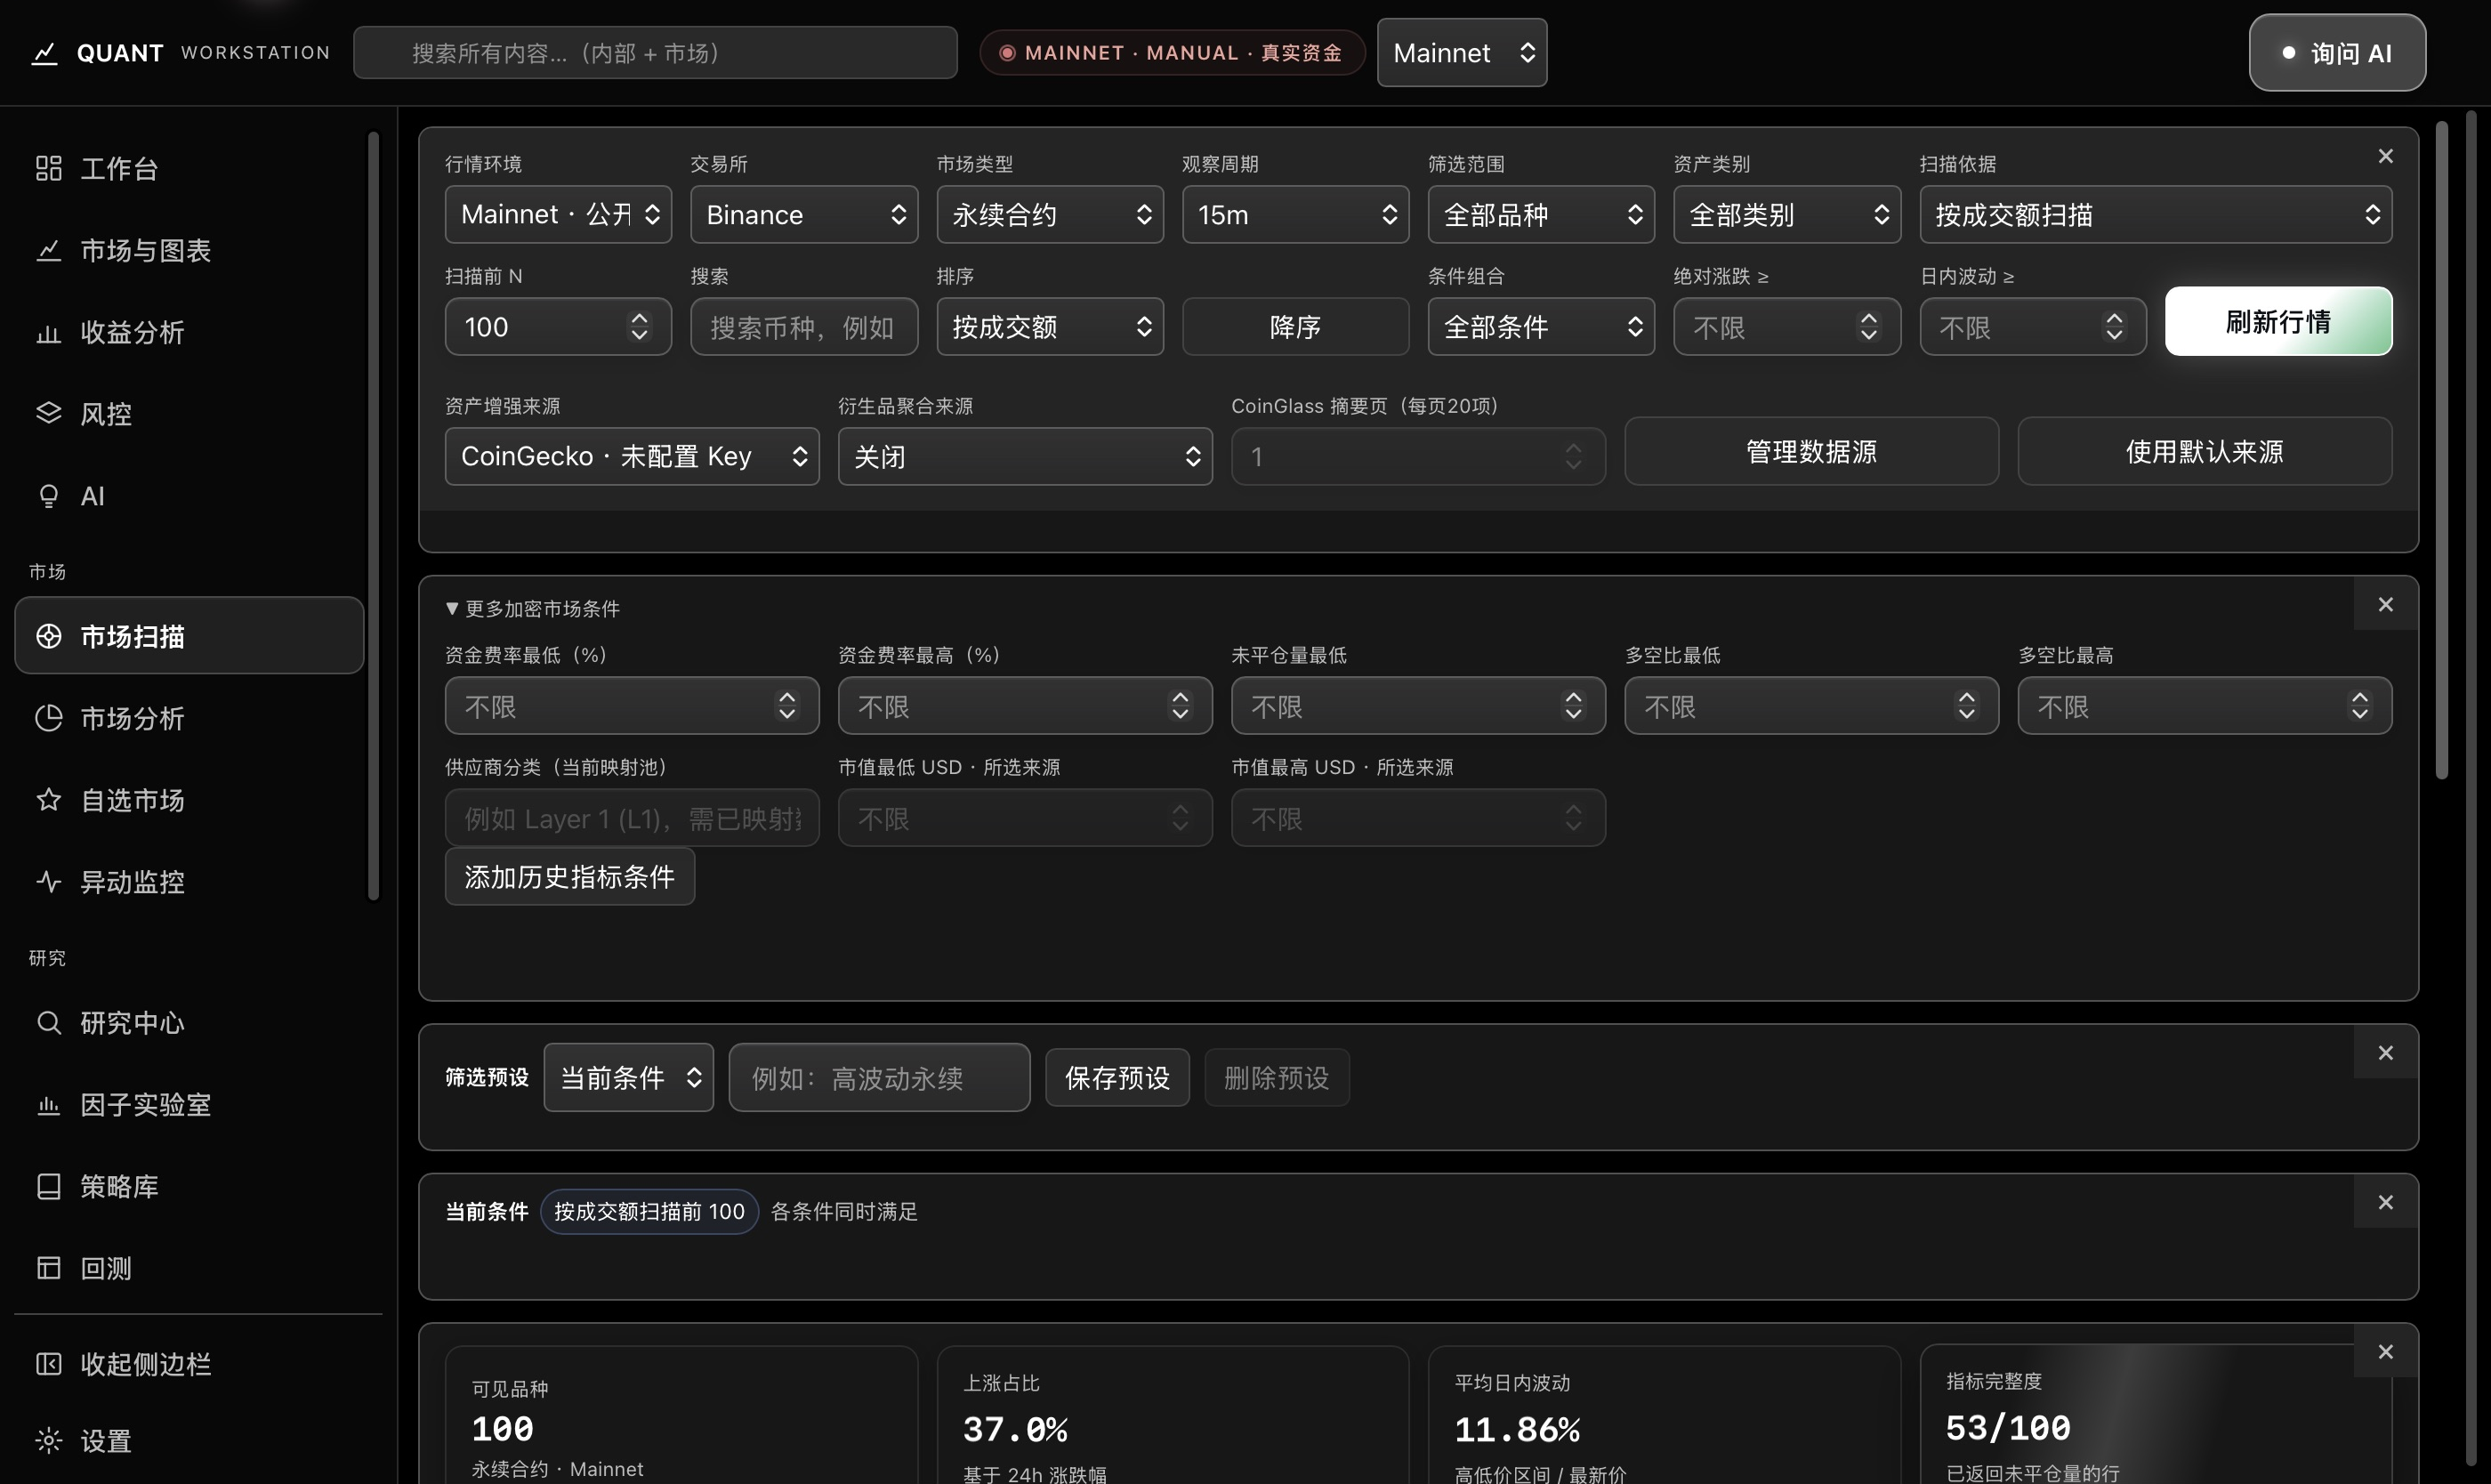
An actual workflow: choose a research focus from the top 100 by turnover.

Actual scan example: public Binance perpetual market data, with a 15m observation interval. The screenshots retain the captured list and its state.

Action
Select perpetual instruments and scan the top 100 sorted by turnover. This example applies no additional numeric change or volatility limits.
Observed result
Candidates such as BTCUSDT and ETHUSDT show market indicators and mini candlesticks in one list. Compare movement before choosing an instrument for further research.
Next step
Open the full chart, add a watchlist entry, or continue to AI direction forecasts and prediction history for that candidate. Combine conditions and save a preset when a narrower scope is needed.

Test an idea before choosing the next step.

Start with a strategy, compare parameter candidates, and connect factor research to historical returns. Spend less time on repeated setup and more time reading the evidence.

  1. One-click strategy backtests

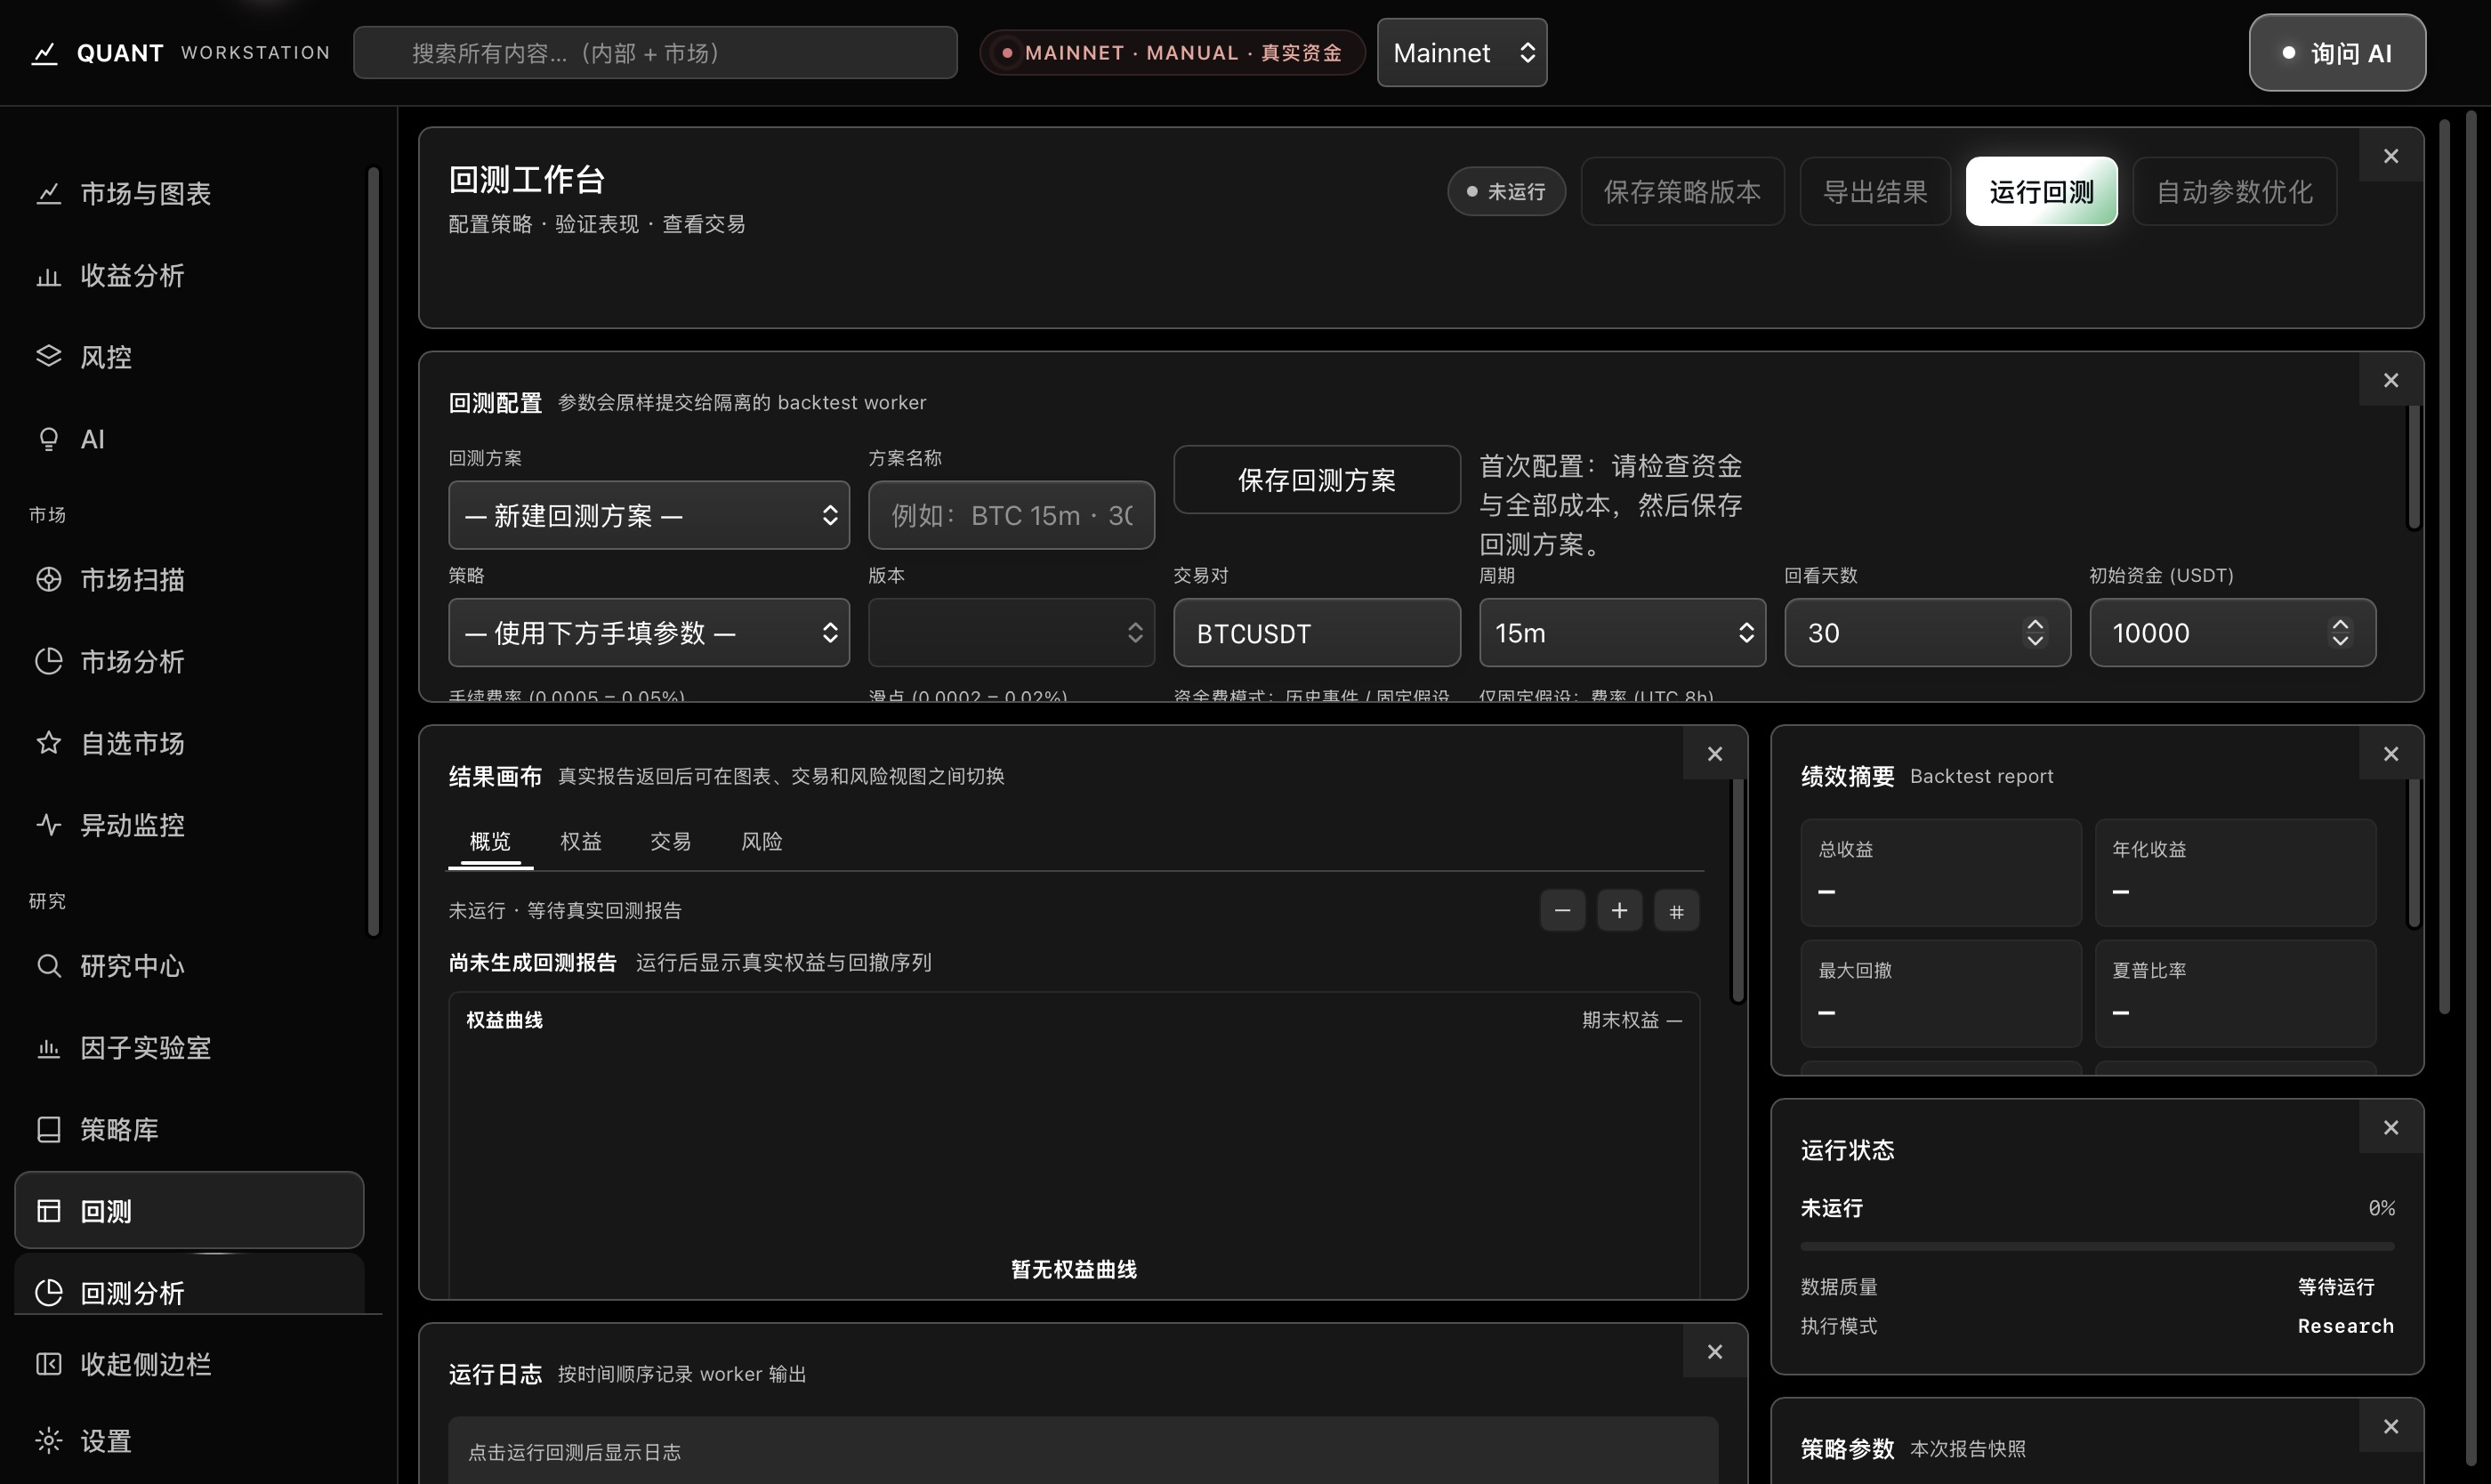
    Start from a selected strategy version and reuse a saved plan. Read returns, drawdown, costs and trades together.

  2. Automatic parameter comparison

    Compare supported parameter combinations automatically. Consider candidate performance with independent validation before saving a new strategy version.

  3. Factor return backtests

    Connect factors to trading rules, then inspect equity, drawdown and trade-level costs. Keep reports to continue the investigation.

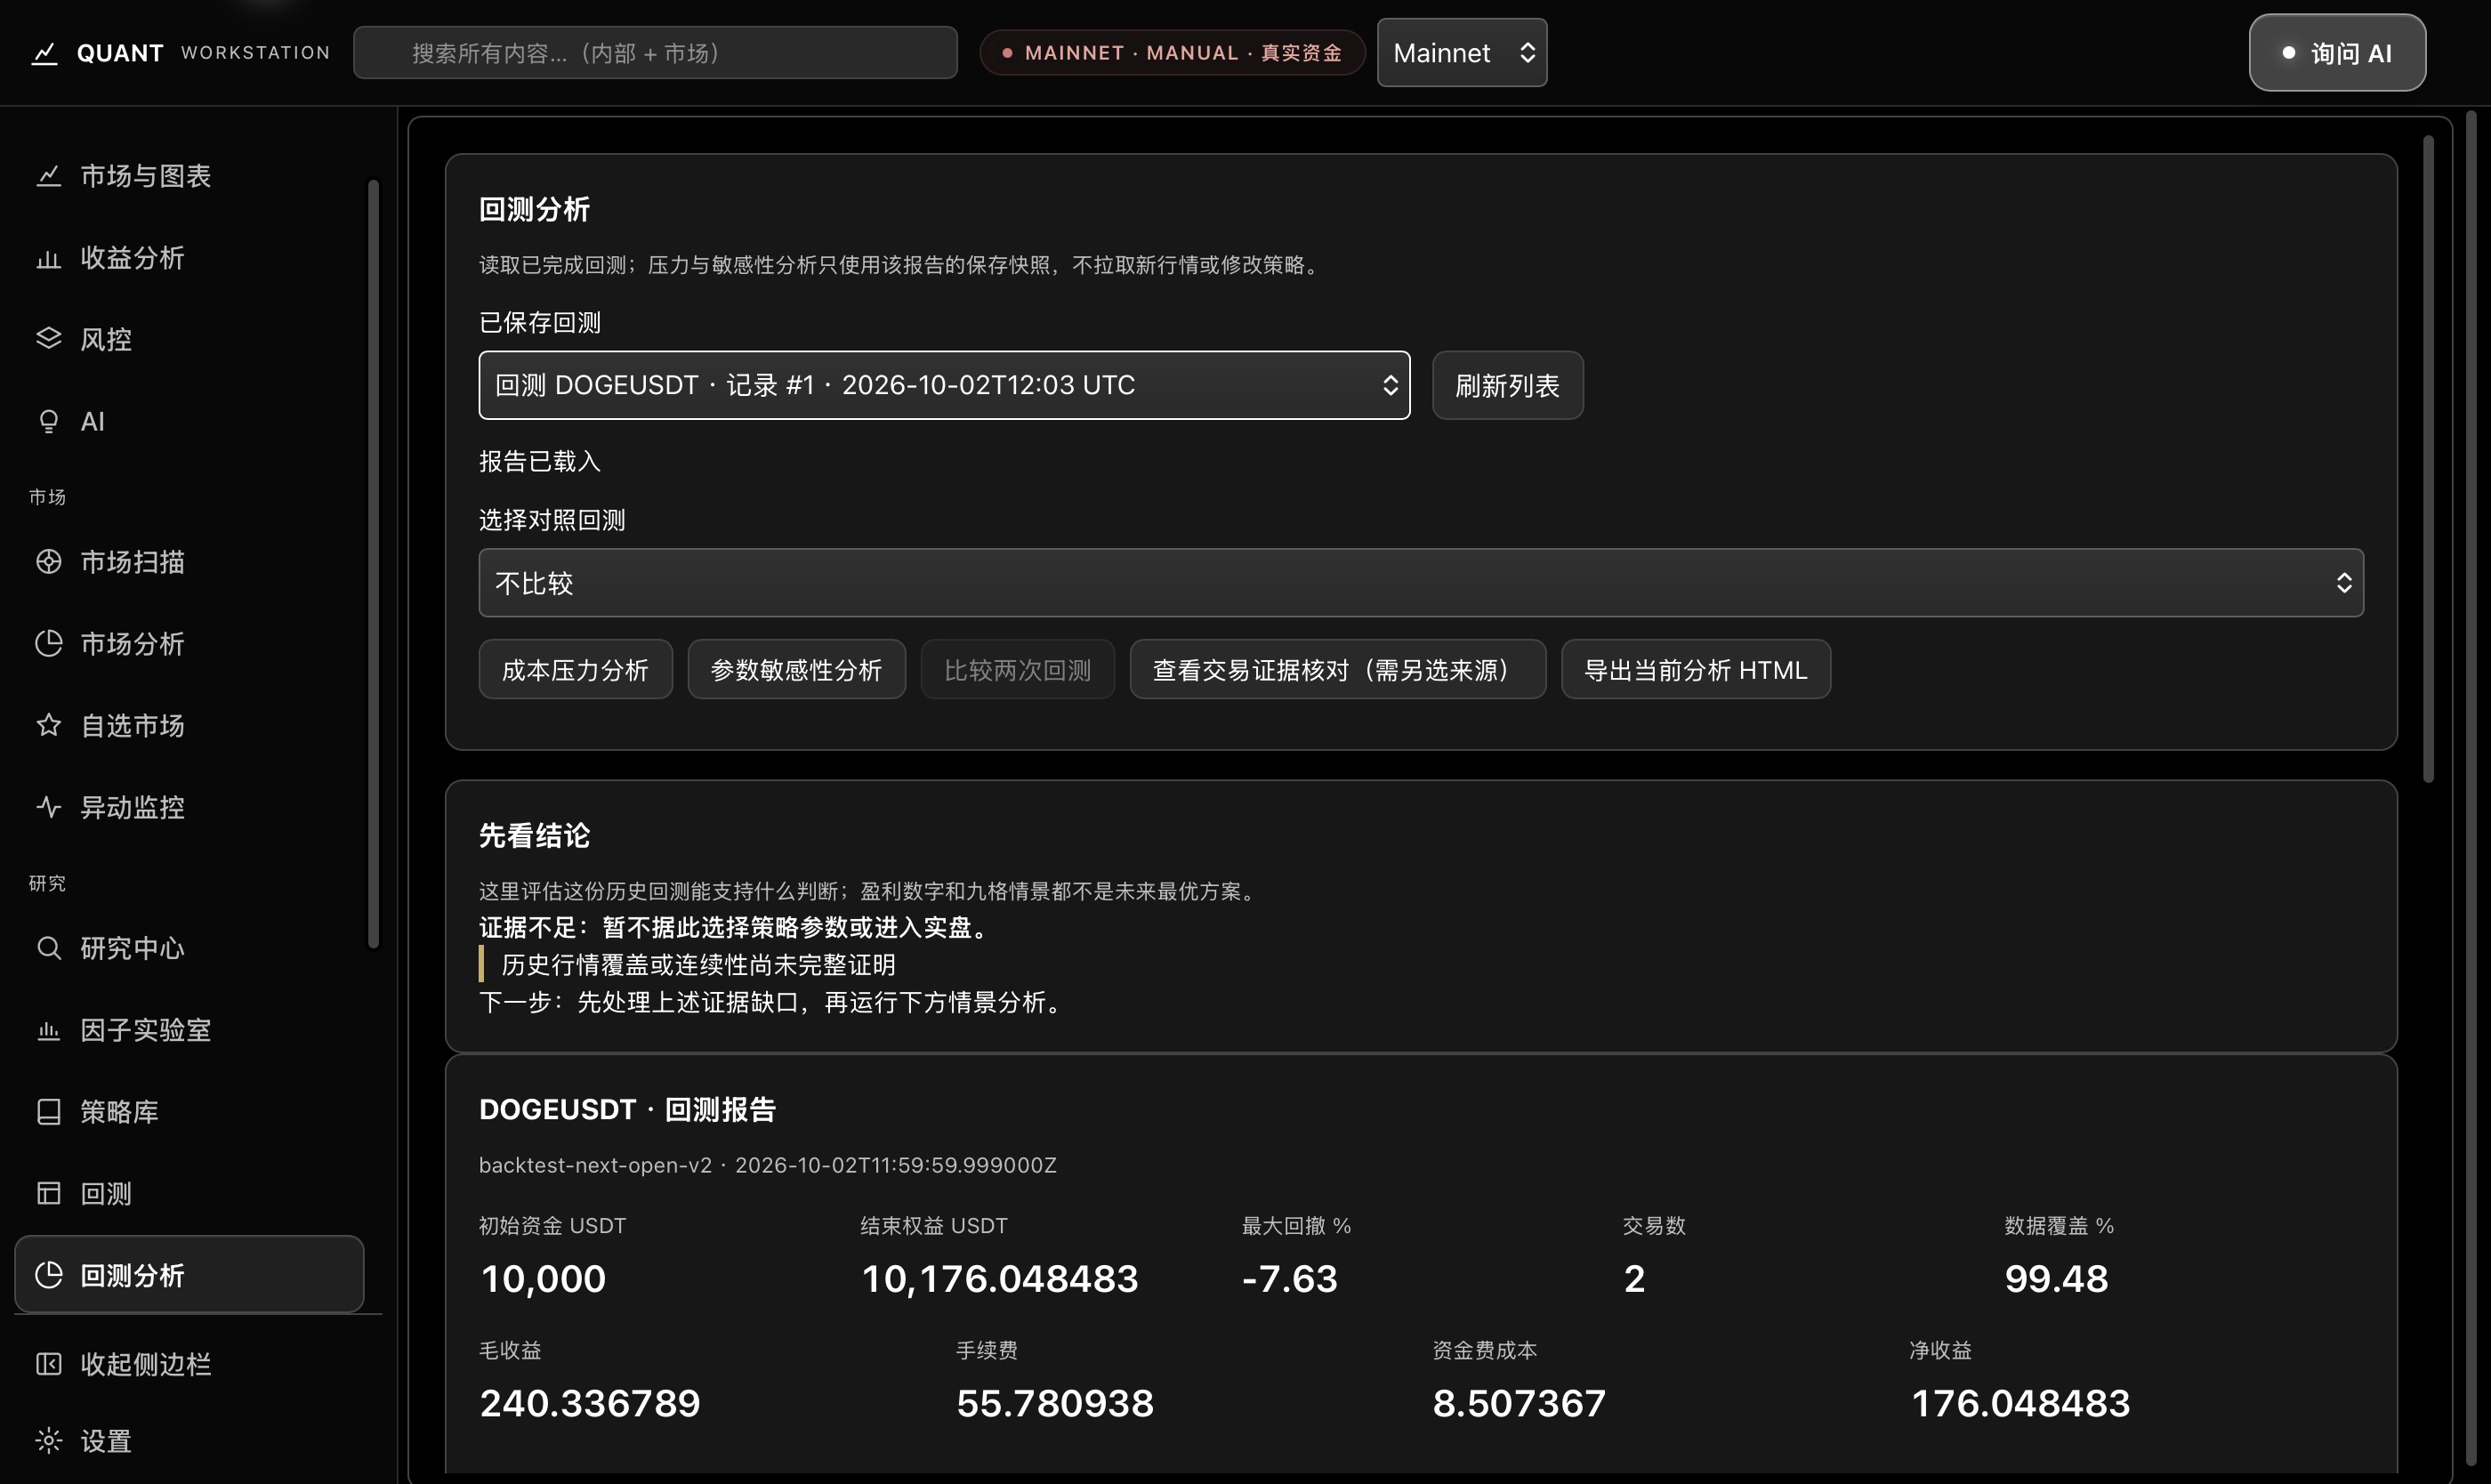
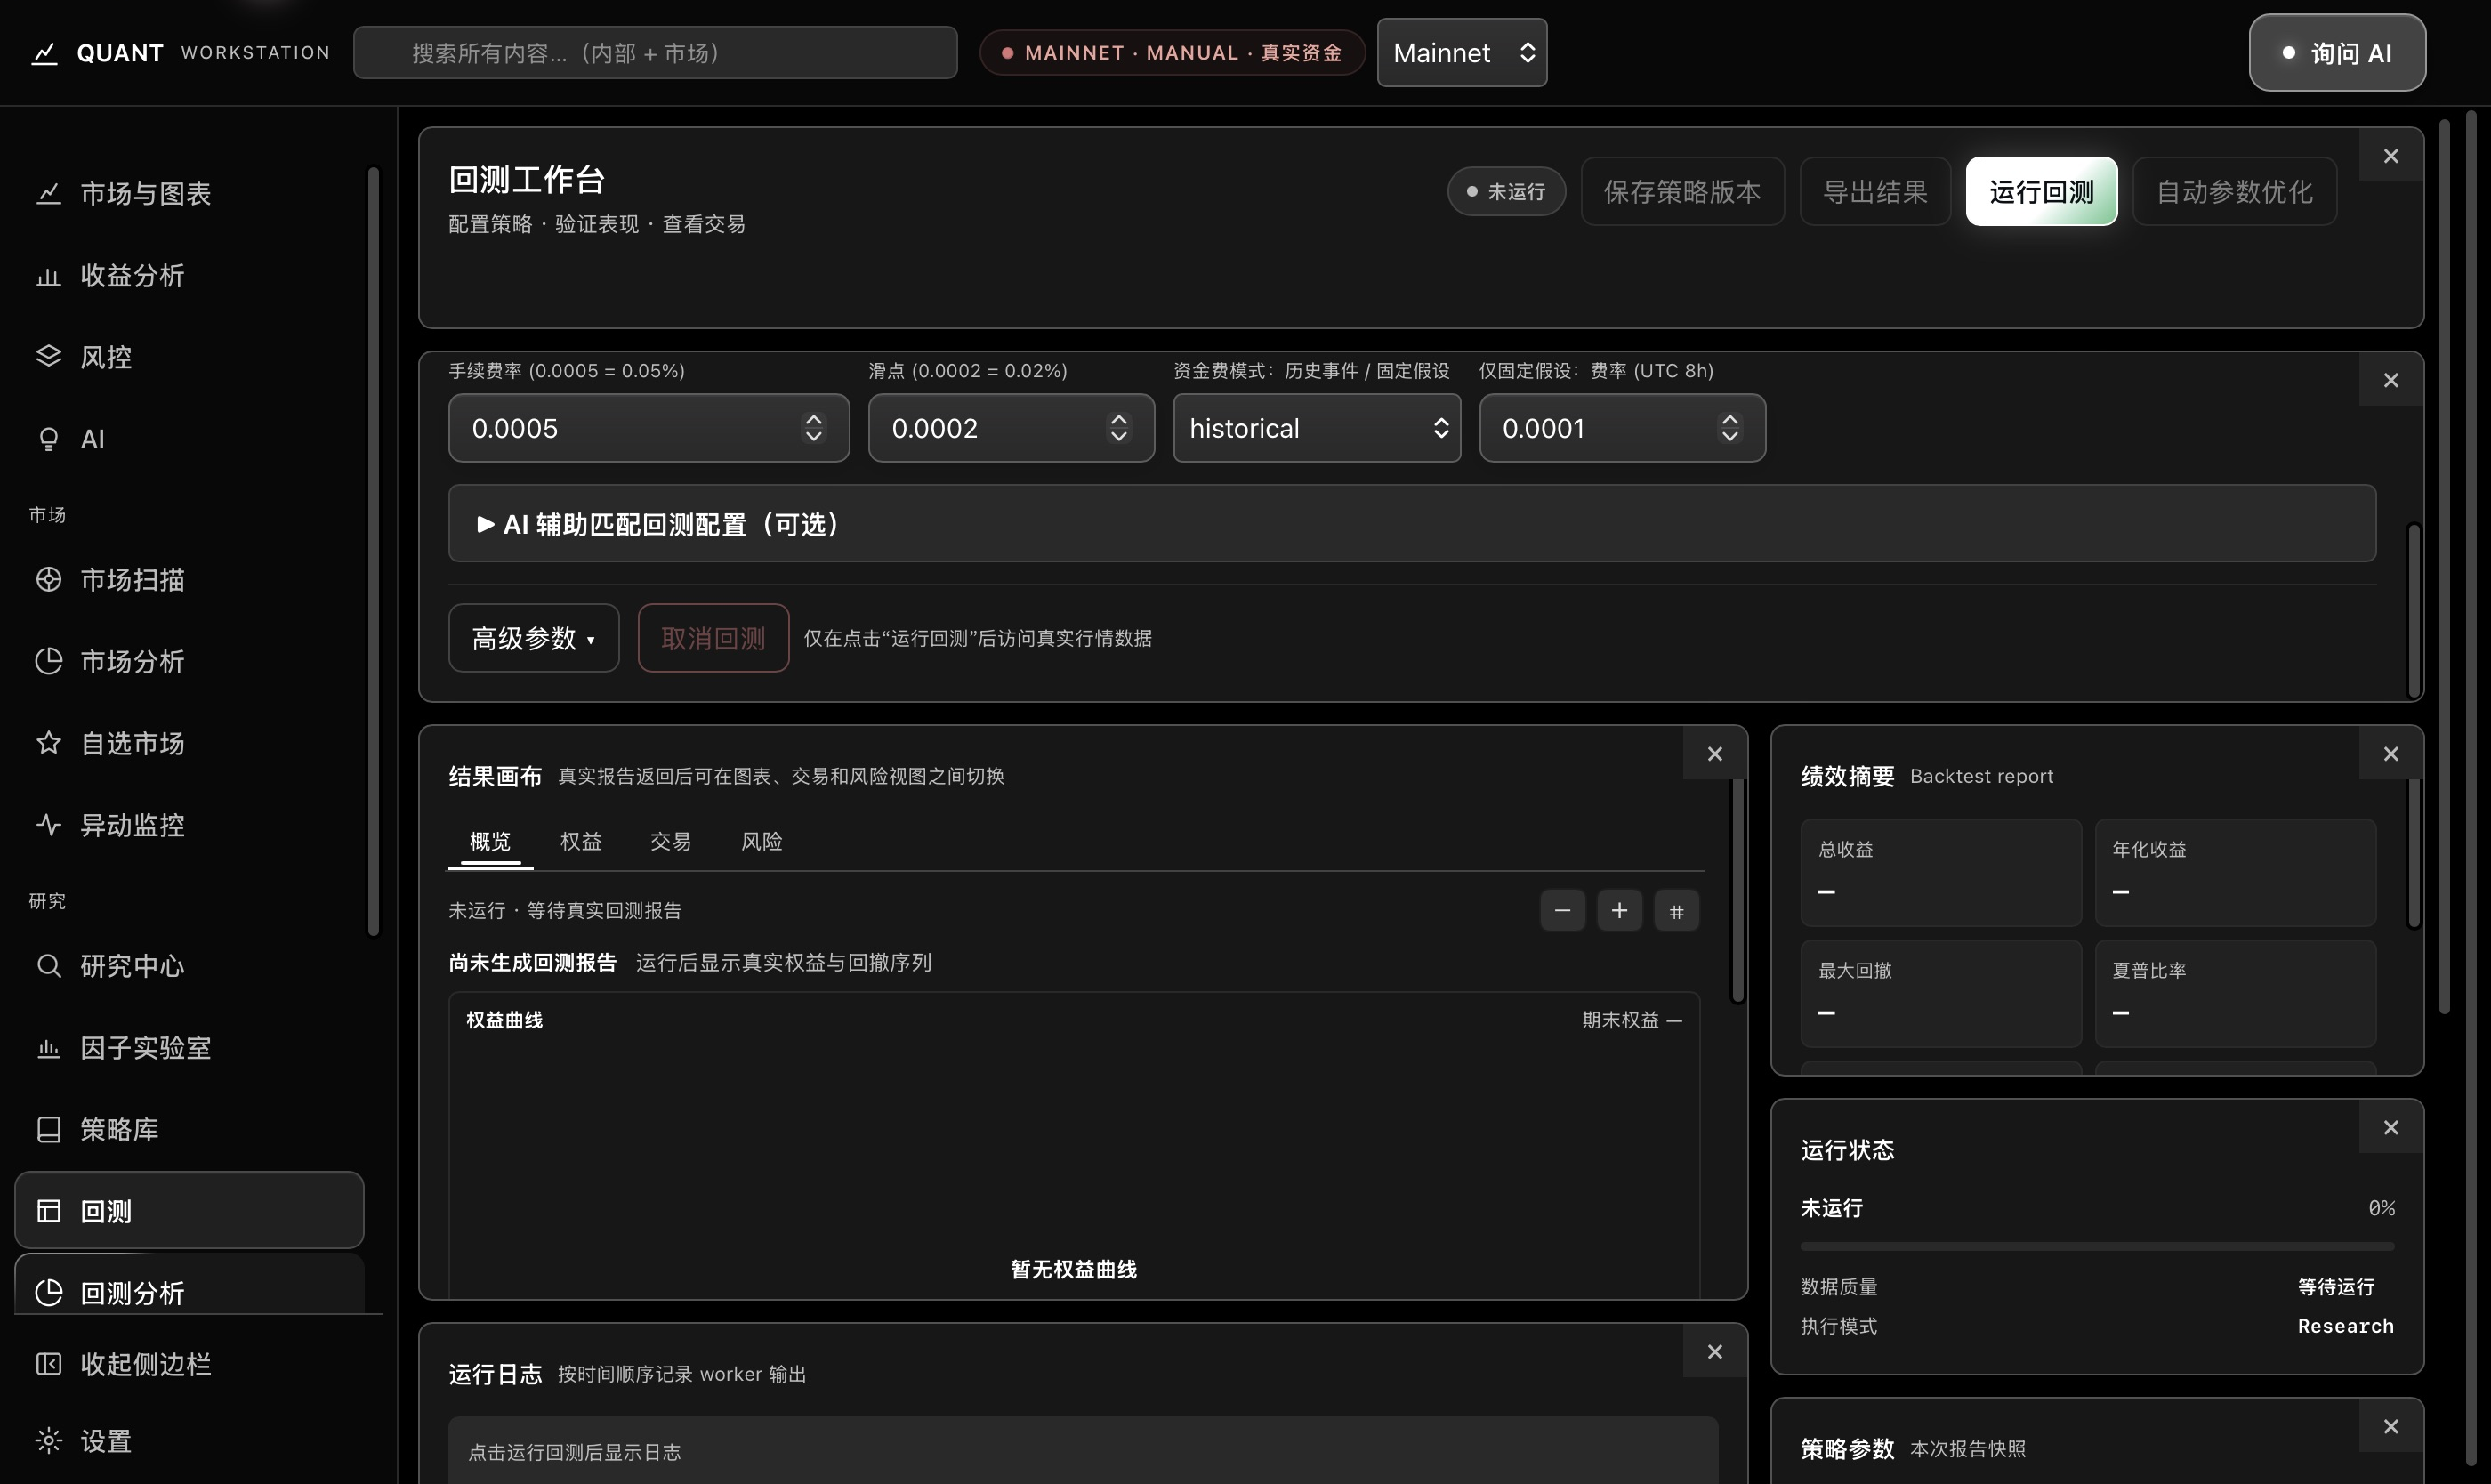
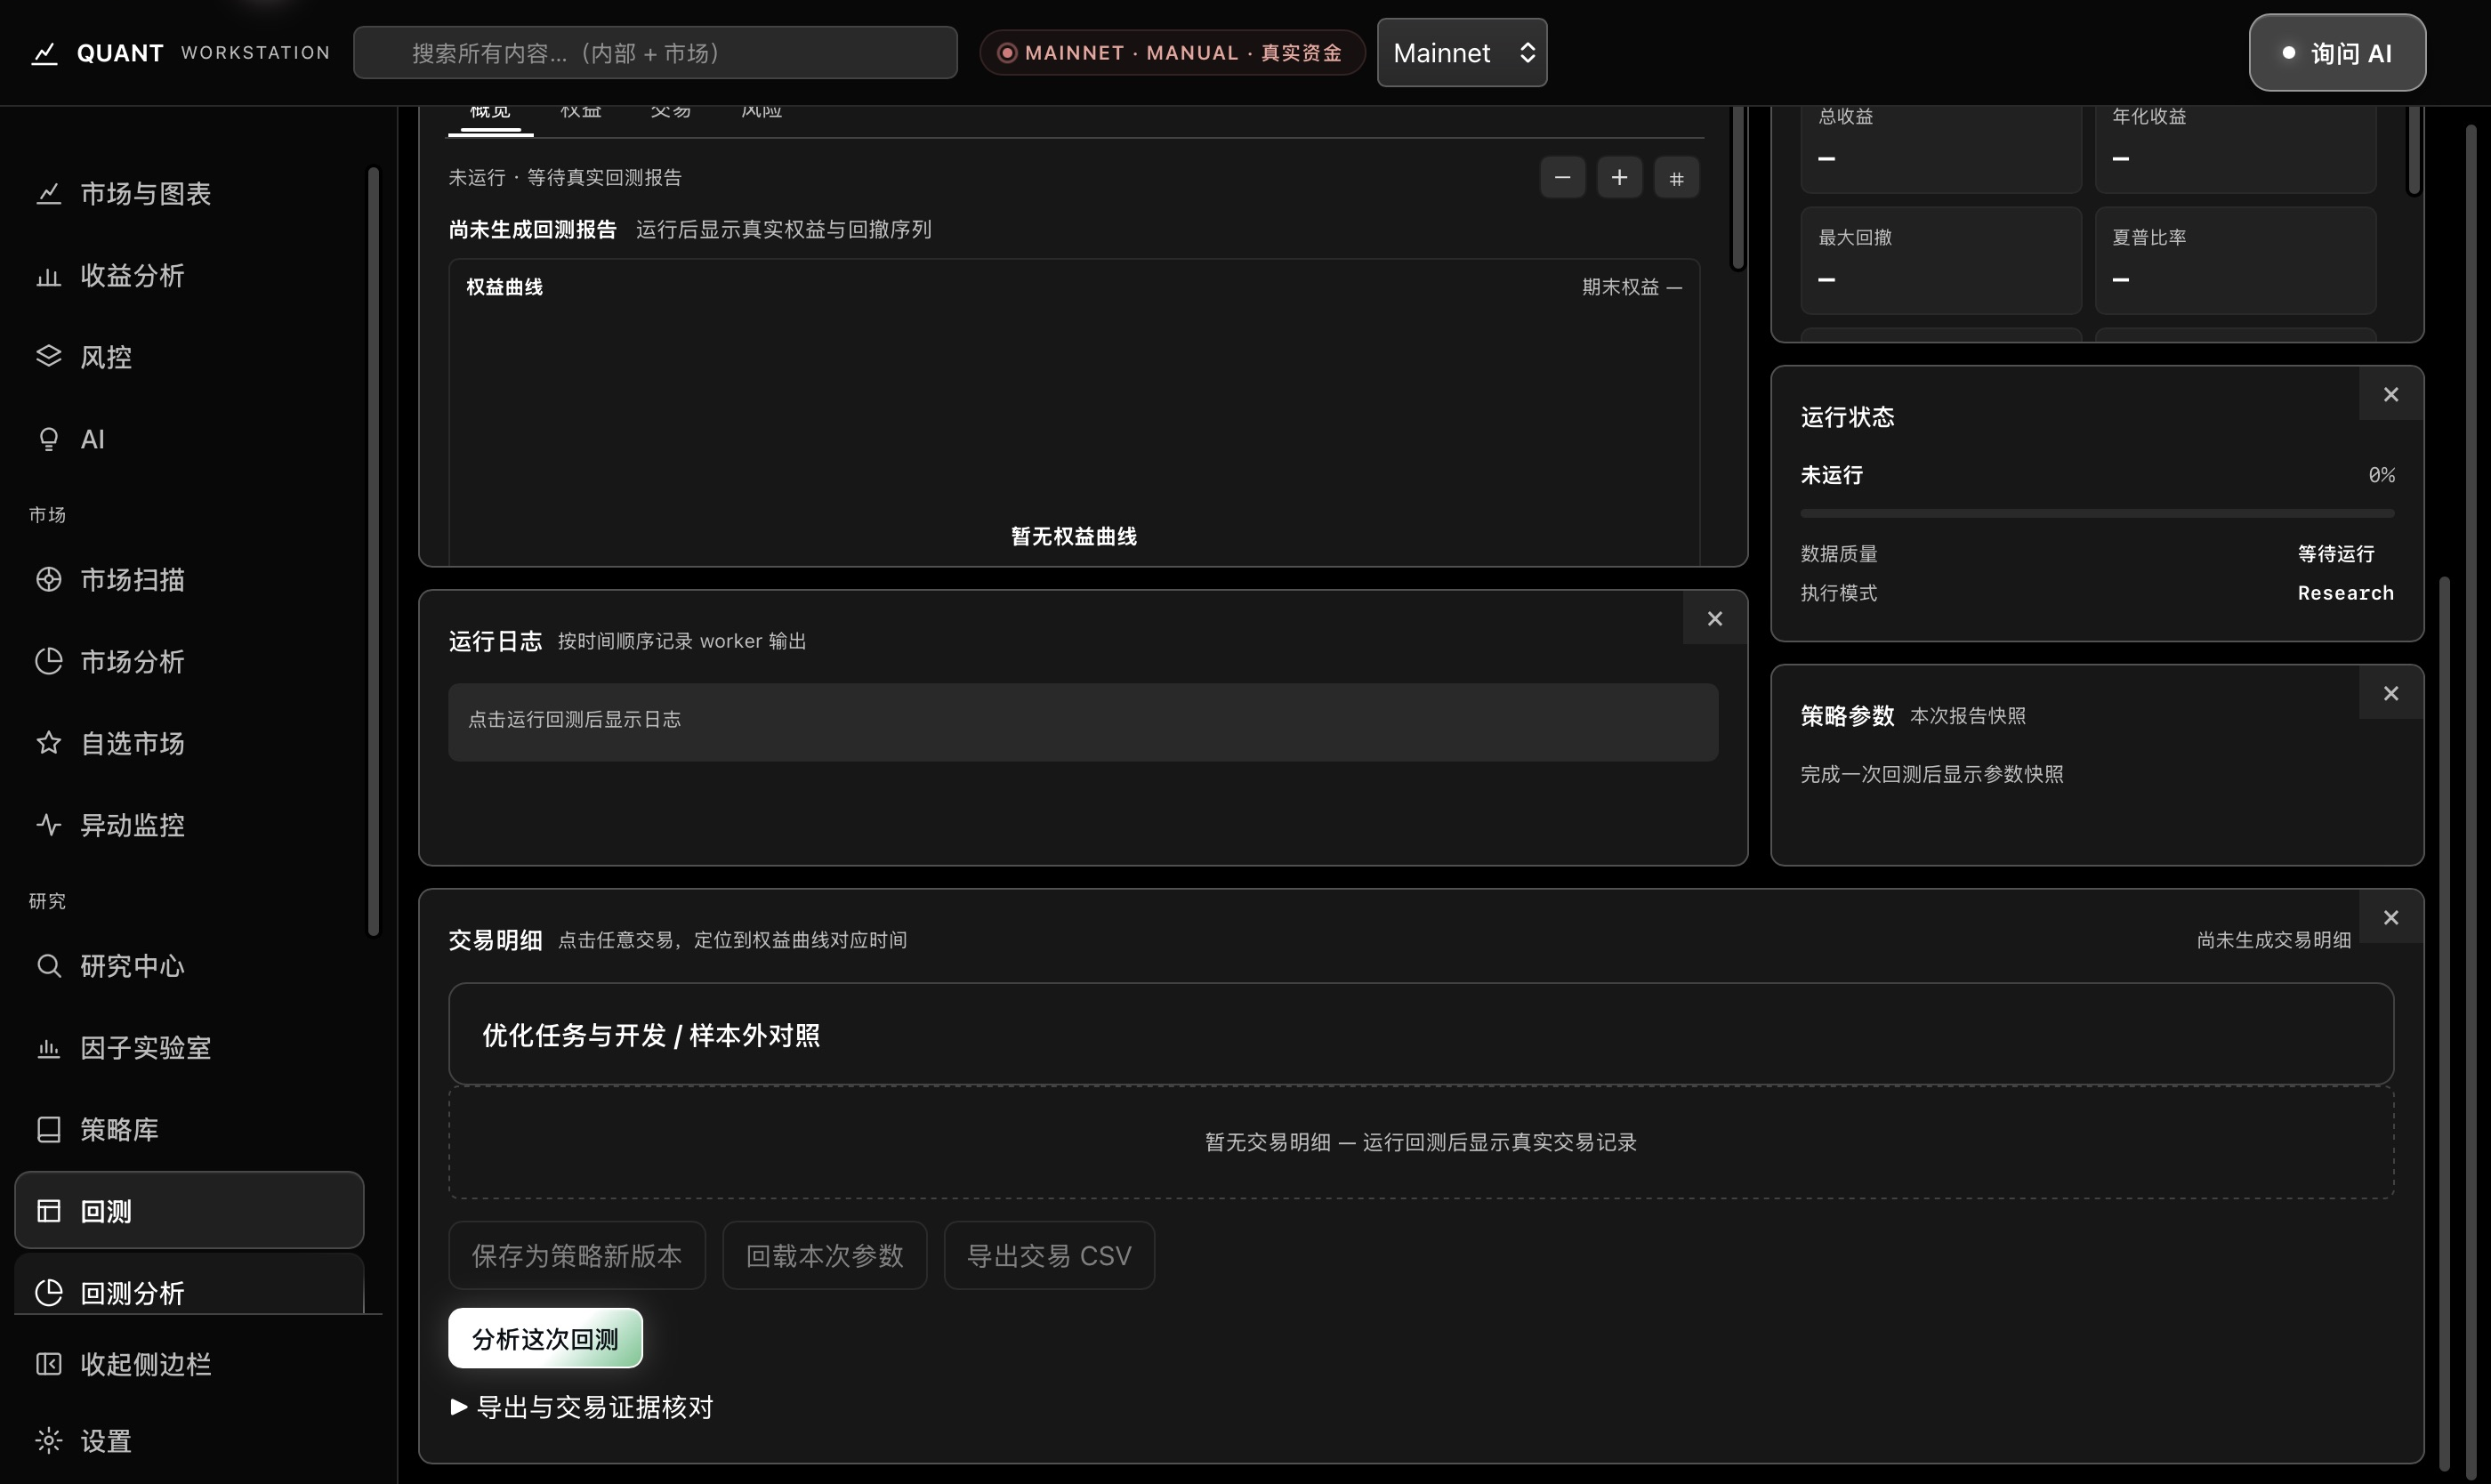
An actual report: what can this DOGEUSDT backtest support?

A saved Demo / Testnet historical backtest example, showing simulated trades and their report rather than live trading.

Action
Open the saved DOGEUSDT report to inspect a 15m backtest that requested two days of historical data.
Observed result
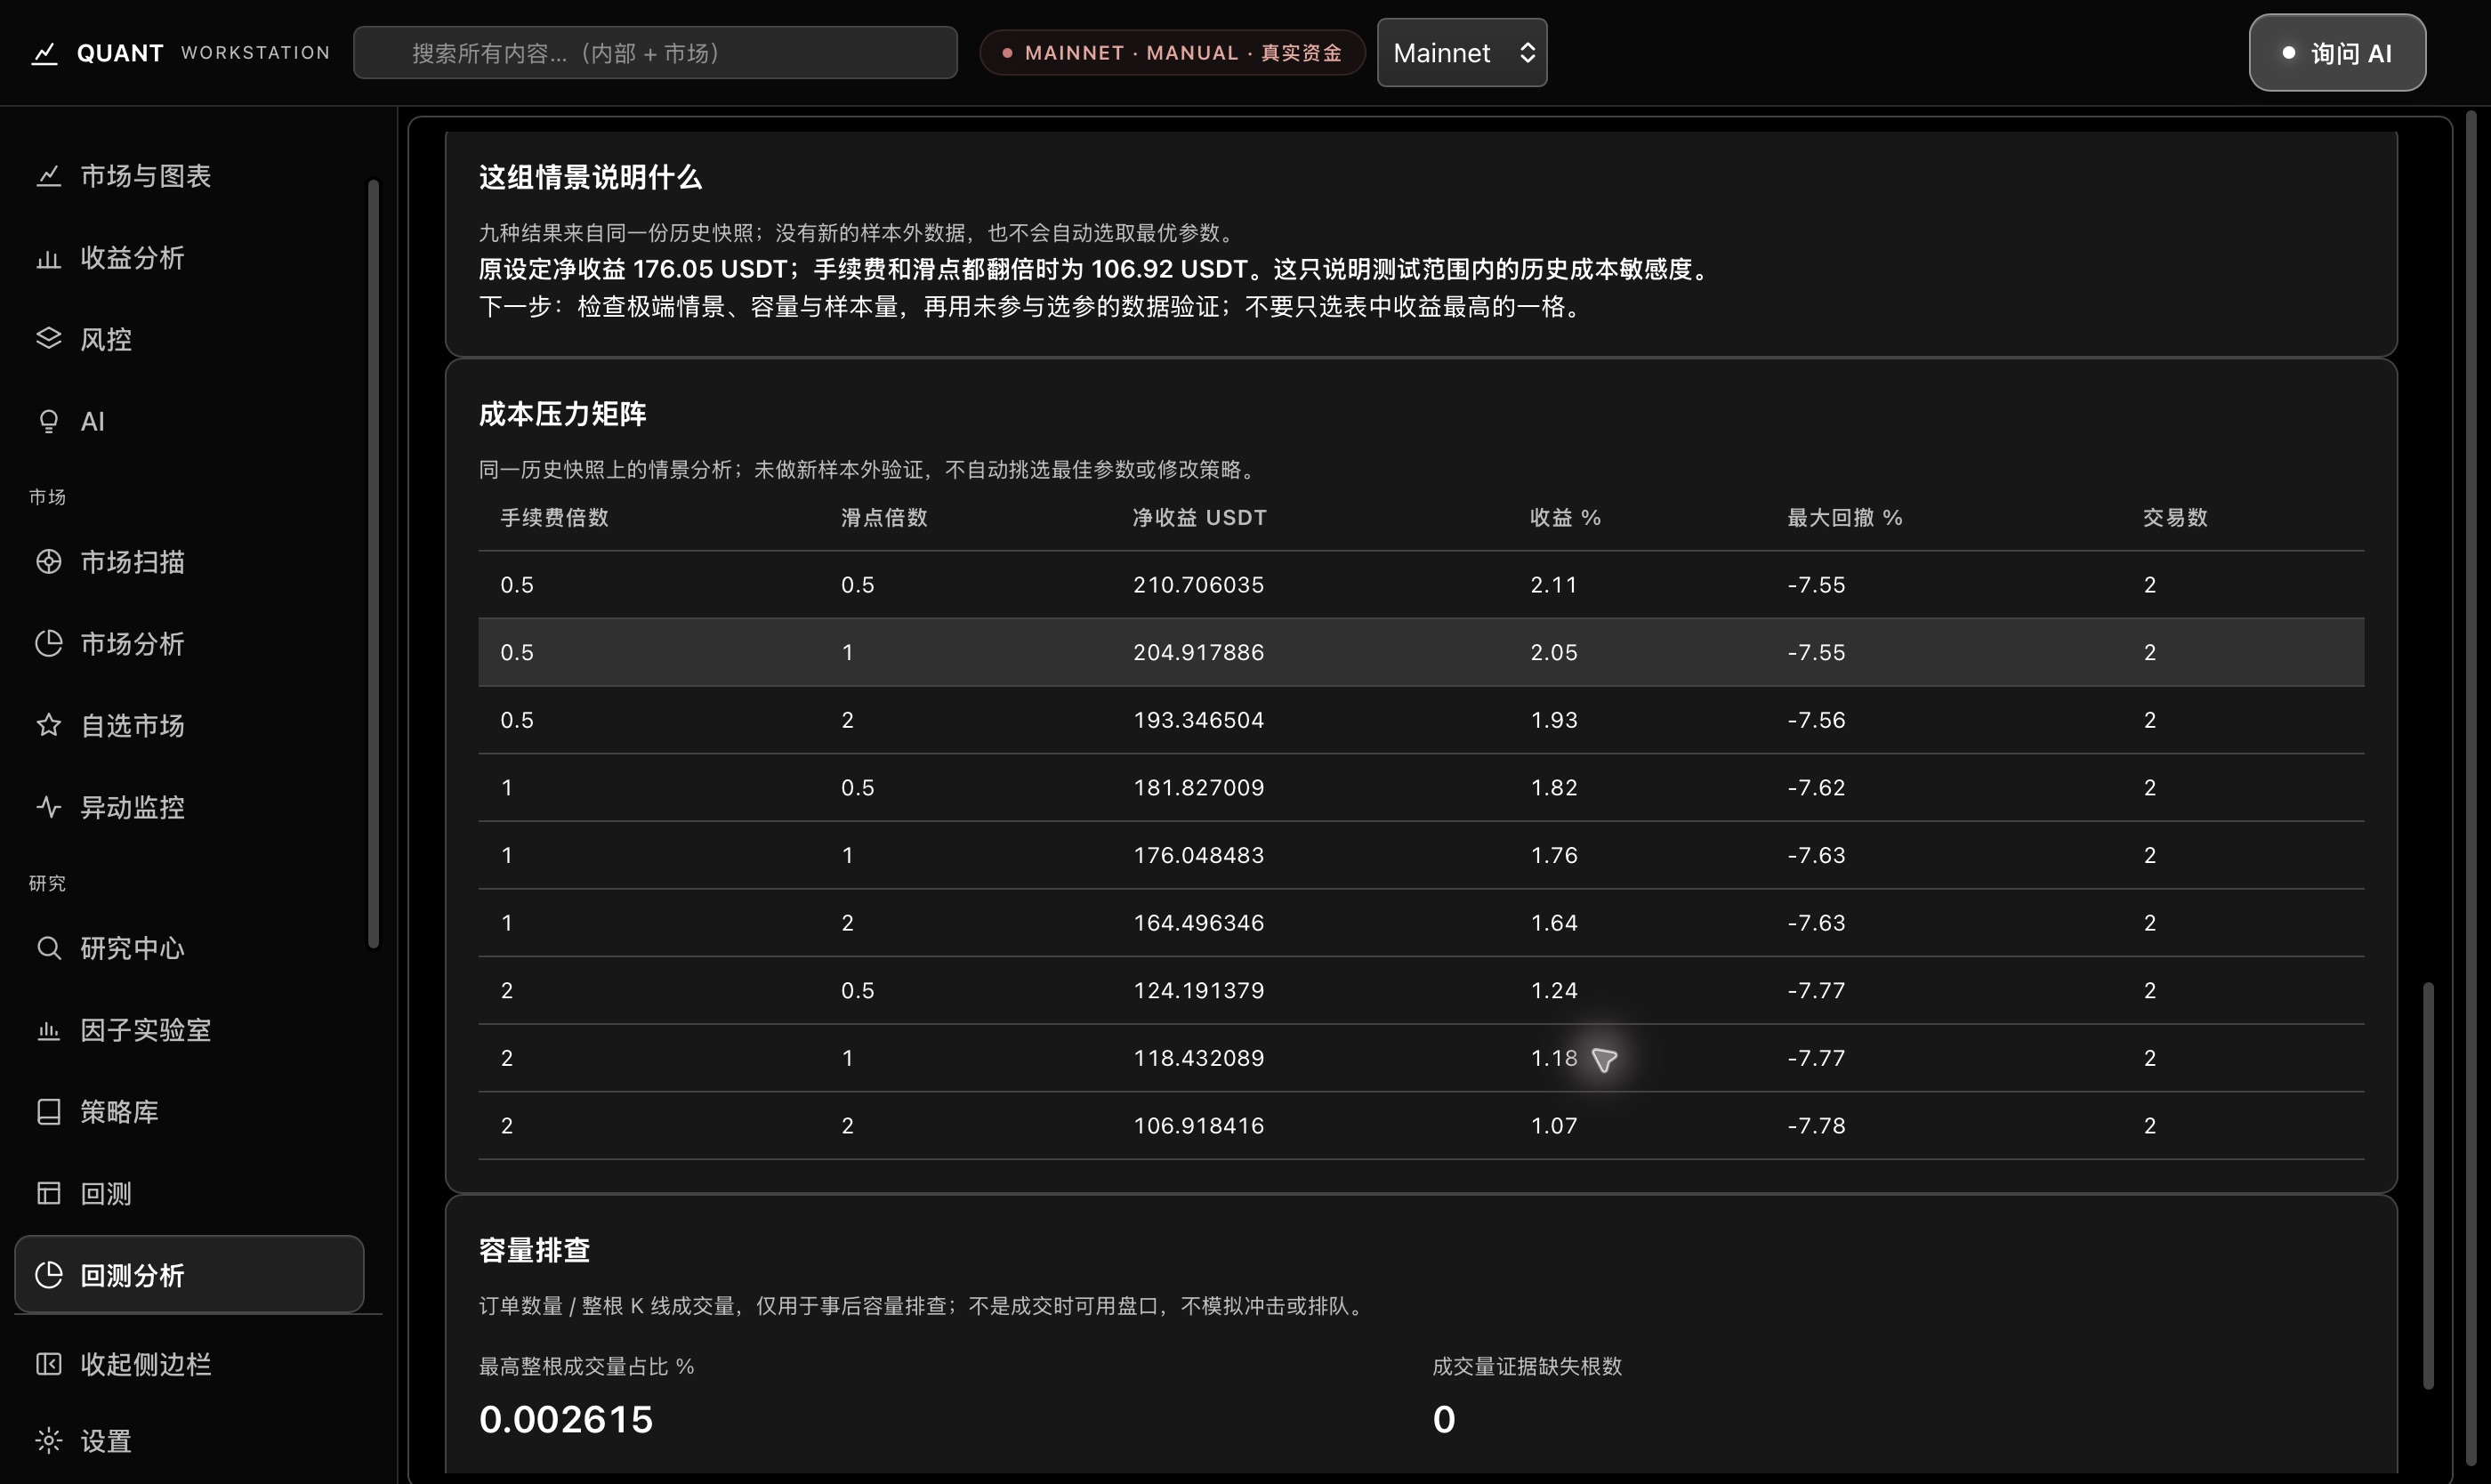
The report records two simulated trades, coverage of 191 / 192 candles (99.48%) and a maximum drawdown of −7.63%. It also retains trading fees, funding costs and an insufficient-evidence notice.
Next step
Review gaps in historical coverage and continuity first, then continue with cost stress and parameter sensitivity. Avoid judging a strategy from its return alone.
Explore an actual saved backtest

Keep execution connected to review.

Keep charting, orders, positions, running status and risk in one workstation. Return to retained records to understand the process and guide the next investigation.

Match orders and fills, then review with evidence.

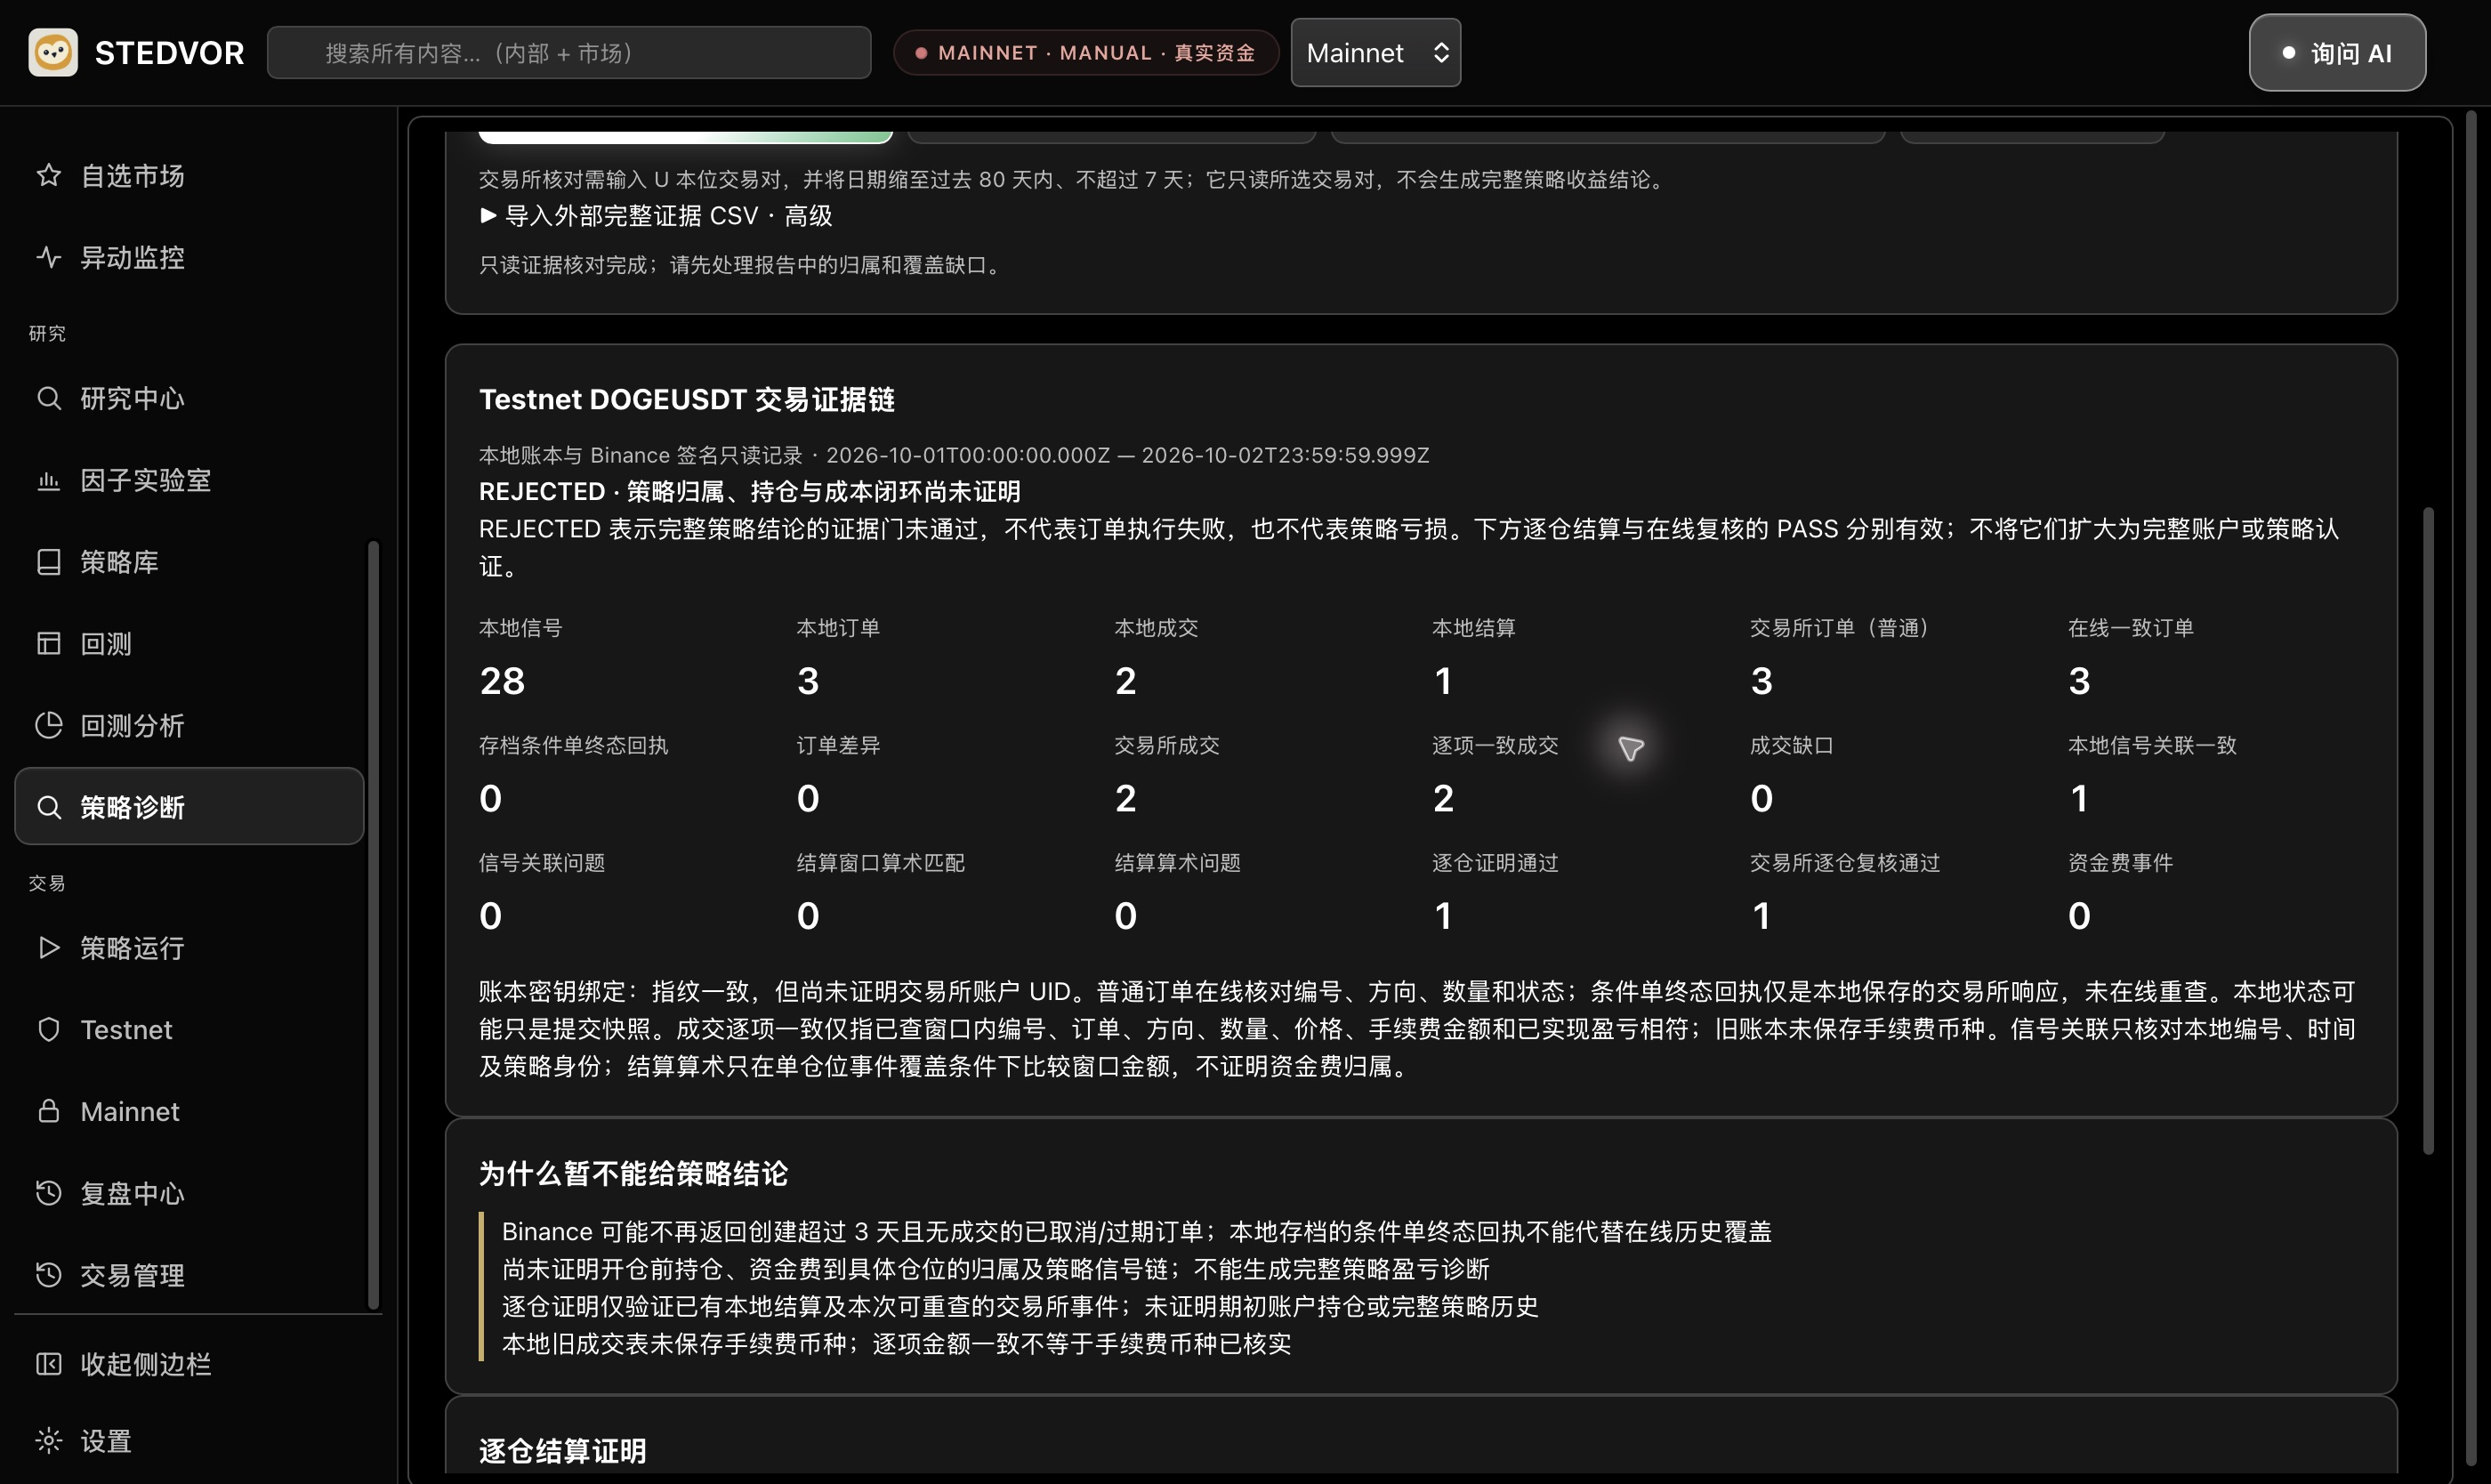
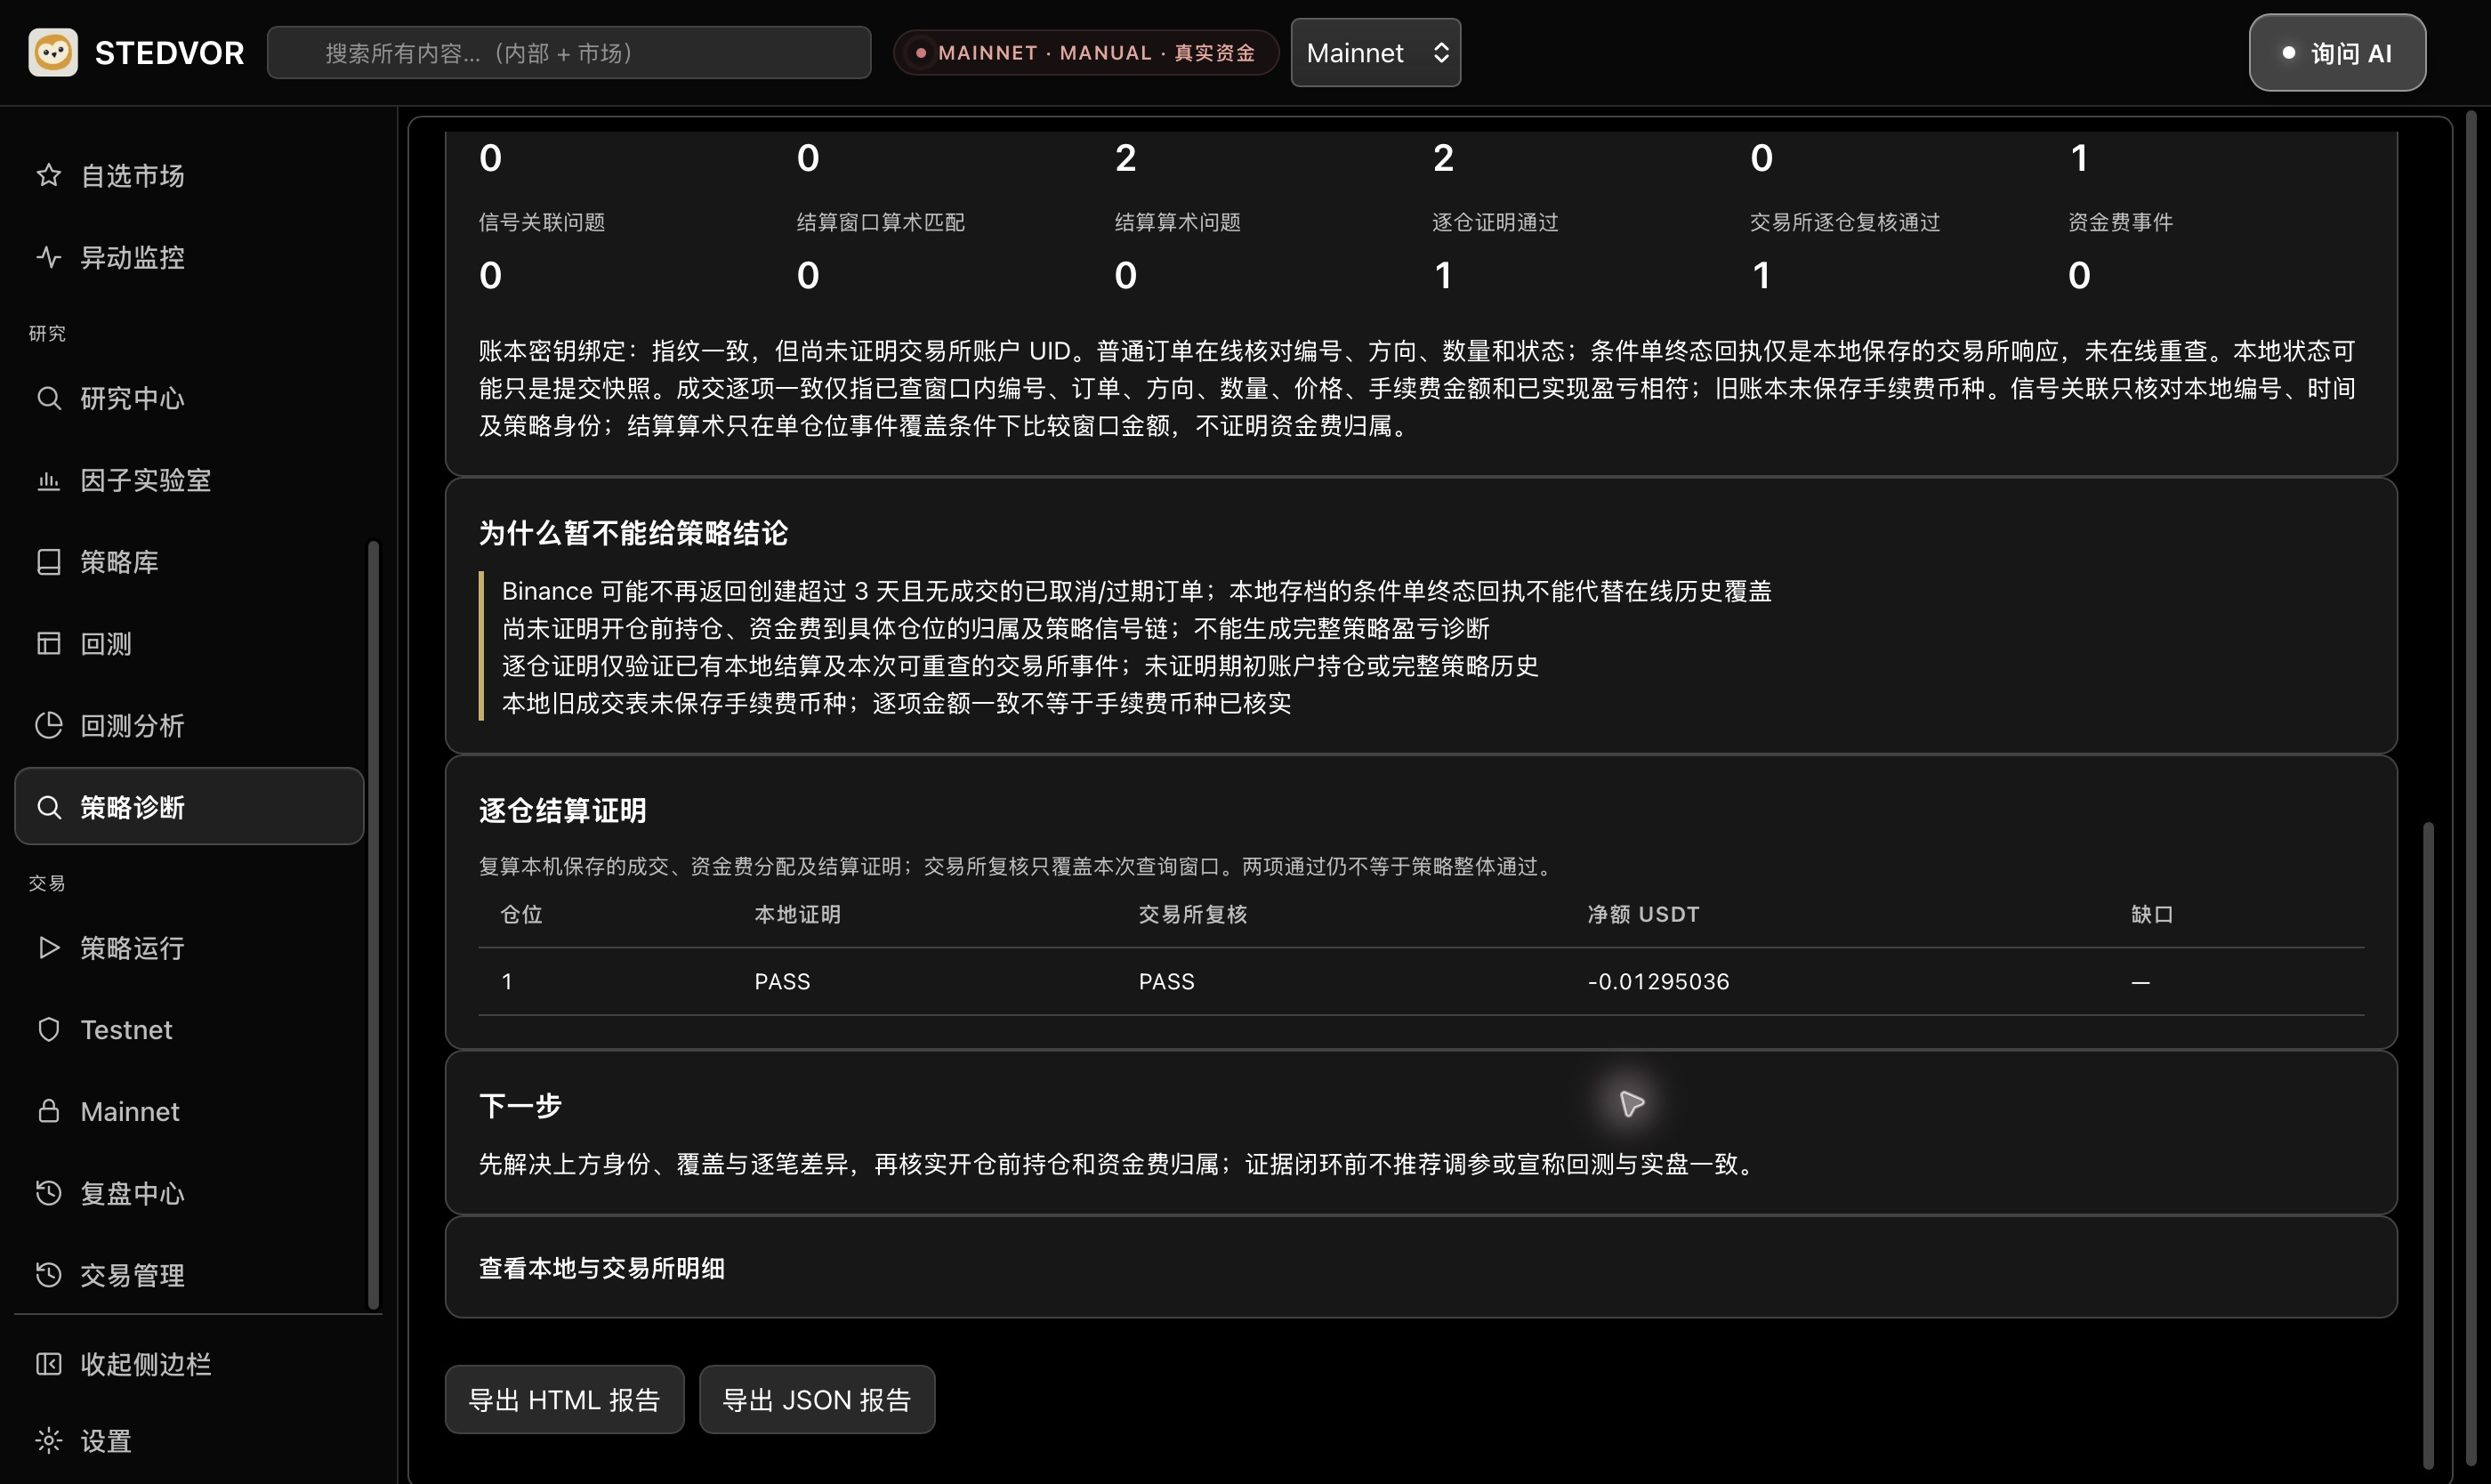
An actual read-only Testnet DOGEUSDT check in the installed software. Two full windows show record matching and per-position settlement. The native header retains its environment display; this check concerns Testnet.

Action
Select the local DOGEUSDT record to bring in its symbol and UTC dates, narrow the window, then compare local and exchange orders and fills in read-only mode.
Observed result
Three orders and two fills match, with zero differences. One per-position settlement proof and its exchange recheck both show PASS. The overall strategy result remains REJECTED because attribution and historical coverage evidence is incomplete.
Next step
Export the report and retain the confirmed records. Complete opening-position, strategy-linkage and funding-attribution evidence before continuing the full strategy review.

AI assistance, from understanding to direction research.

Ask about unfamiliar terms and workflow steps, or explore a market direction forecast for a selected symbol. Directional views are model estimates for research; provider and model configuration are required.

For example, research ETHUSDT over the next hour.

Historical feature example · not live market data. These results summarize a real saved AI estimate. The software screenshot below shows its configuration and question entry point.

Choose a subject and a question

Will the target closing price in one hour be above the reference price?

Model estimate: up
65.0%
Model estimate: down or flat
35.0%

ETHUSDT · 1h · MiniMax-Text-01
Public market inputs available: 11 / 11.

Read the estimate and its reasoning

This estimate favored an upward move, considering trading activity, short-term price changes and volatility. Read the reasoning and uncertainty alongside the direction.

Keep the record and review it later

Retain the original estimate and check the observed price change after its horizon ends. This historical example has no completed outcome evaluation.

This model estimate is uncalibrated. 65% does not represent accuracy, expected return, profit probability or position advice.
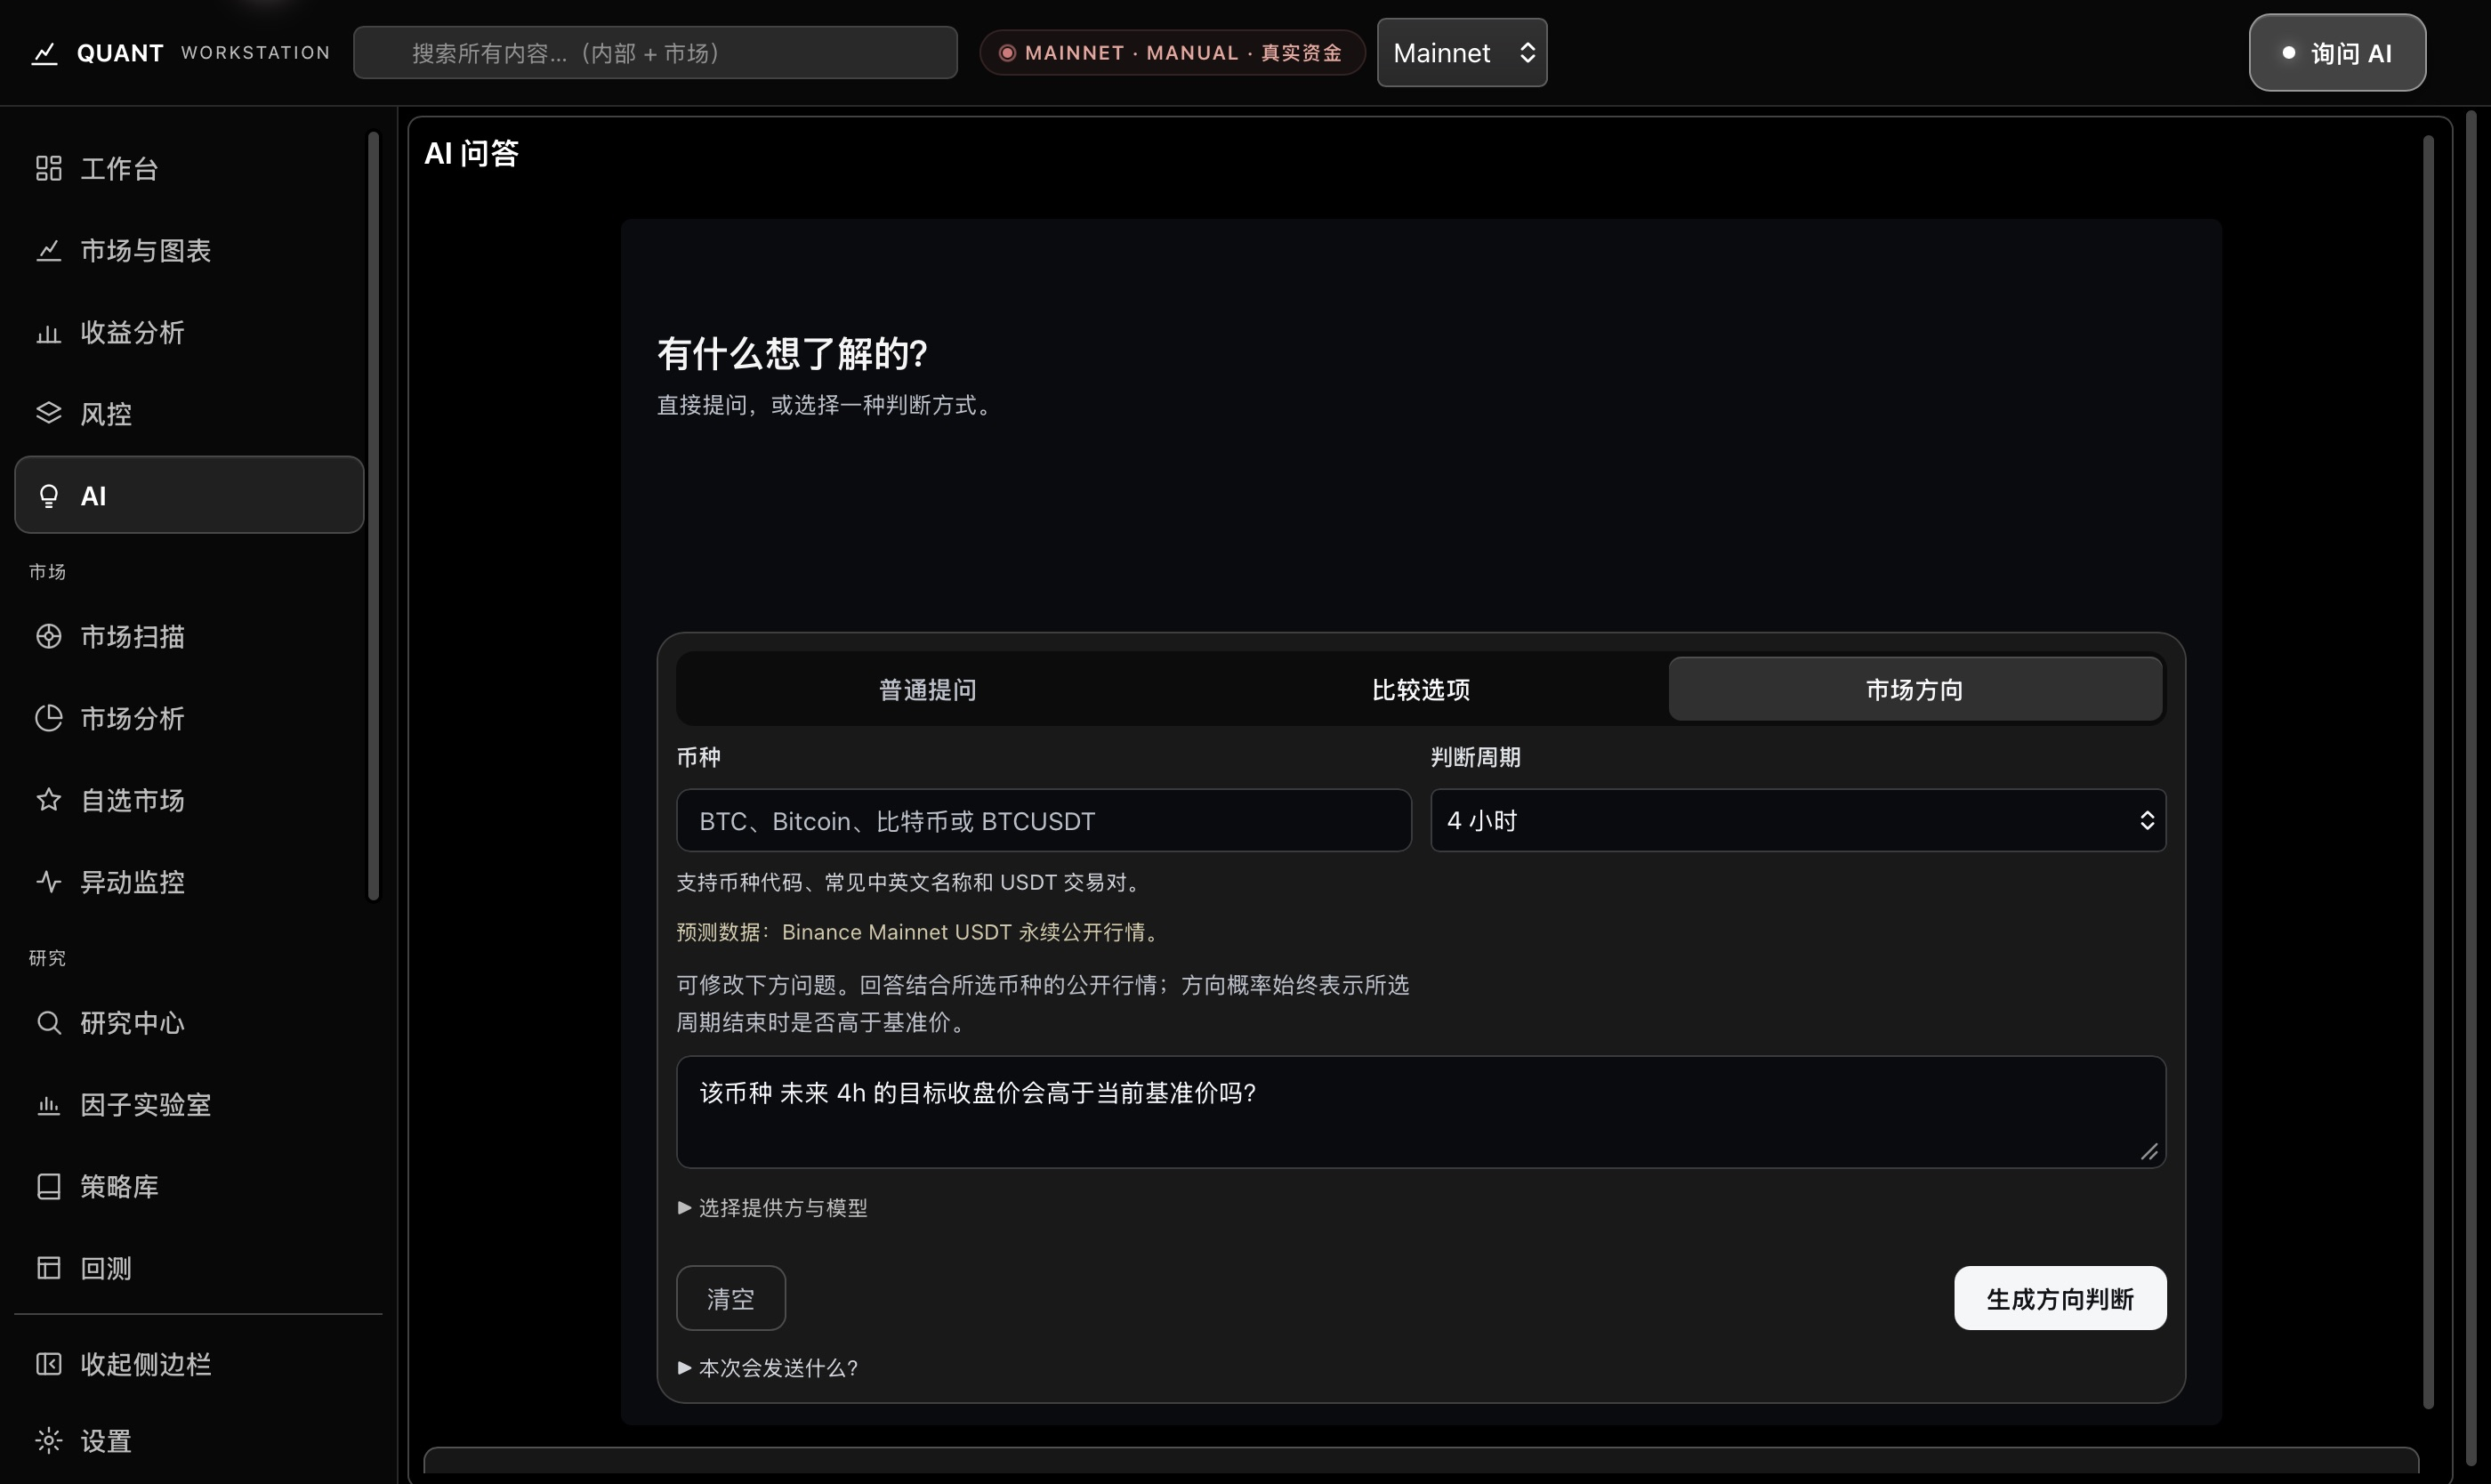
Start with your own question

You could ask: “How should I interpret drawdown and trading costs when reading a backtest?”

Example question. Actual answers and direction forecasts depend on your configured provider, model and available service.

Automated workflows. Less repetition.

Run configured, authorized strategies while monitoring orders, operating status and risk. Return to the records for review, with repeated work managed and recorded.

  1. Validate
  2. Authorize
  3. Controlled run

Manage runs · Monitor execution · Stop when needed
Current automation verification covers Testnet. Trading requires explicit authorization.

Connected tools from market observation to trade review.

Explore all eight categories, from everyday observation to research, execution and review.

Markets & chartsSee changes. Keep your focus.
Workspace overview
Bring returns, markets, risk, data health, signals and events into one workspace and arrange the layout around your needs.
Scanning & filtering
Combine market scope, change, volatility and turnover conditions. Save filter presets, sort fields and scan mini candlestick charts.
Watchlists & groups
Keep candidates in watchlists and groups, then continue into charting and direction analysis.
Charting tools
Multiple timeframes, familiar indicators, annotations and focused views. Open a full chart from a scanner candidate.
Data sources
Inspect source availability and missing-data notices. Configure enhanced sources when needed and consider data conditions when defining research scope.
Materials & researchKeep research connected.
Research materials
Organize text, links and documents as research material that remains available after archiving.
Document review
Read original pages, recognize content and check materials by hand while retaining source context.
Research context
Keep source context so each investigation can build on material already collected.
Factors & strategiesDevelop ideas over time.
Factor research
Organize factor hypotheses and candidate ideas, then continue into comparison and validation.
Factor return backtests
Connect factors to trading rules and inspect equity, drawdown and trade-level costs in historical results.
Batch comparison
Compare candidate research directions in one workspace and retain results for later analysis.
Strategy library
Manage strategies, parameters and research outputs together, then select a specific version to test.
Versions & lifecycle
Retain strategy iterations with archiving, recovery, import and export, and save a new version when you choose.
Backtests & analysisValidate before acting.
Historical testing
Select market and timeframe conditions to examine a strategy idea against historical data.
One-click strategy backtests
Reuse a saved plan from a selected strategy version to spend less time configuring and more time analyzing.
Automatic parameter optimization
Compare supported parameter combinations and consider candidates with independent validation before choosing the next investigation.
Visual results
Read equity, drawdown, costs and trades together to understand both results and the process.
Costs & scenarios
Include costs and assumptions in comparisons to see how they affect historical results.
Comparisons & reports
Compare runs and retain analysis with report exports so later research can build on previous results.
Trading & riskManage execution and protection.
Trading workspace
Keep the chart, order book and order entry area in one view within supported markets and environments.
Orders & positions
View orders, fills and positions, continue into supported cancellation and exit actions, and revisit execution records.
Protection & limits
Keep protective settings, limits and execution status visible so operating conditions and risk remain clear.
Strategy operations
Manage configured, authorized runs, monitor status and stop when needed.
Risk review & rehearsal
Understand limits before execution, inspect risk during operation and keep workspace status in view.
Performance & reviewLearn from retained records.
Performance analysis
Read profit and loss, drawdown, costs and actual records together to understand performance and attribution.
Review workspace
Revisit trade records alongside research and organize the next improvement to investigate.
Diagnostics & reconciliation
Check the time window, record counts and status while keeping missing material alongside the conclusion.
Export & retention
Keep reports and records for later investigation, review and comparison.
AI & notificationsUnderstand and stay informed.
AI questions & assistance
Understand terminology and workflows. Use 1h, 4h and 24h market direction forecasts, reasoning and historical review with a configured provider and model.
Notification settings
Manage configured channels and inspect sending records and availability.
Workspace & dataMake the workspace your own.
Workspace customization
Adjust layouts, themes and preferred pages to organize your own workspace.
Runtime status & logs
Inspect operating status and activity logs, then use specific records to locate problems.
Local data management
Manage research material, local data, backups and recovery for continued work.
Settings & connections
Configure data sources, account connections, models and assistance services as your workflow requires.

This is a product capability overview. Features, supported environments and edition entitlements follow the official release notes.

Choose your edition.
Start with your workflow.

Focus on the research and trading that matter.

What do you need to get started?

Explore the interface first, then configure it for your workflow. Enhanced data, AI and trading connections can be prepared separately.

Desktop & edition
The interface shown comes from the macOS Apple Silicon app. The Basic release notes will confirm supported systems and included capabilities.
Markets & research
Basic scanning needs no enhanced-source key. Optional enhanced sources require your own key and applicable quota.
AI & trading
AI requires provider and model configuration. Third-party quotas and any service fees follow the provider’s terms. Trading also requires account configuration and explicit authorization.
Check systems and getting started

Need an independent review of your records?

See a sample report Explore the separate review service

Before you get started.

Who is this for?

Individuals, independent traders and small or midsize teams who want research, validation, execution and review in one workstation. This does not imply cloud collaboration or organization permissions.

Does Basic include everything shown?

This page is a product capability overview. Basic stays free. A macOS Apple Silicon preview is available; see its release notes for the included scope. Full costs CNY 119 per month. Entitlements and subscription availability will be announced.

What can AI and automation do?

AI helps explain terminology and workflows, and supports market direction forecasts with reasoning and historical review. Directional views are model estimates for research, with a configured provider and model. Current automation verification covers Testnet; Mainnet automation is outside that scope. Account setup, explicit authorization and applicable controls are required for trading. Notification delivery depends on channel configuration.

Where do these screenshots come from?

All images come from the installed macOS application, with rectangular cropping only. Workspace panels display Testnet data; the operational mode badge is retained. The installed interface retains its earlier name; STEDVOR is the official brand. Screenshots illustrate the interface and usage scenarios. Historical results do not predict future returns; available capabilities follow the release notes.

Prepare an experience or demo request

Outline your workflow and questions for a later conversation.

Contact details are pending. Nothing is sent.

Open the full feedback form

Bring the work together.

Explore the actual interface